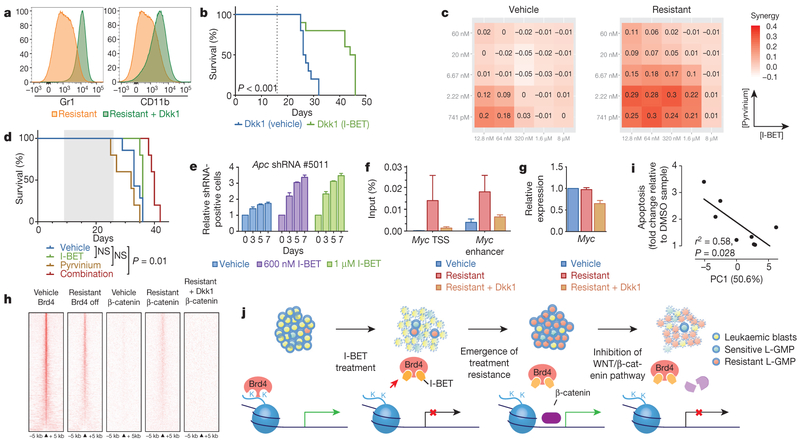
Figure 4 |. WNT/β-catenin signalling regulates sensitivity to BET inhibition.
a, Dkk1 results in re-expression of differentiation markers (Gr1+/CD11b+). b, Kaplan–Meier curve of vehicle and I-BET-treated mice after syngeneic transplantation of resistant clone stably transduced with Dkk1 (n = 10 per group, statistical significance calculated using a log-rank test). Dotted line denotes treatment starting on day 16. c, Heat map representation of Bliss interaction index across five-point dose range of pyrvinium and I-BET performed in biological quadruplicate. d, Kaplan-Meier curve of I-BET with/without pyrvinium after syngeneic transplantation of resistant cells. Shaded area denotes active treatment between days 9 and 26 (vehicle n = 7, I-BET n = 5, pyrvinium n = 5, combination n = 5, statistical significance calculated using a log-rank test). e, Viable, shRNA-positive cells after treatment with either vehicle or I-BET normalized to day 0 performed in biological quadruplicate (mean ± s.d.). f, Binding of β-catenin at Myc TSS and enhancer elements in vehicle-treated cells, resistant cells and resistant cells with Dkk1. Mean enrichment relative to input (±s.e.m.) in chromatin immunoprecipitation (ChIP) analysis from biological triplicate experiments. g, Myc expression from biological triplicate experiments (mean ± s.d.). h, Heat map representation of Brd4 and β-catenin chromatin occupancy ranked according to amount of Brd4 binding in vehicle-treated clones. i, Correlation between aggregate relative expression of examined β-catenin pathway genes with responsiveness to I-BET therapy. Statistical significance determined using Pearson’s correlation. j, Schematic model proposing the mechanism of resistance to BET inhibitor therapy in AML.

