
Figure 4. Resting and activated Treg states identified by scRNAseq.
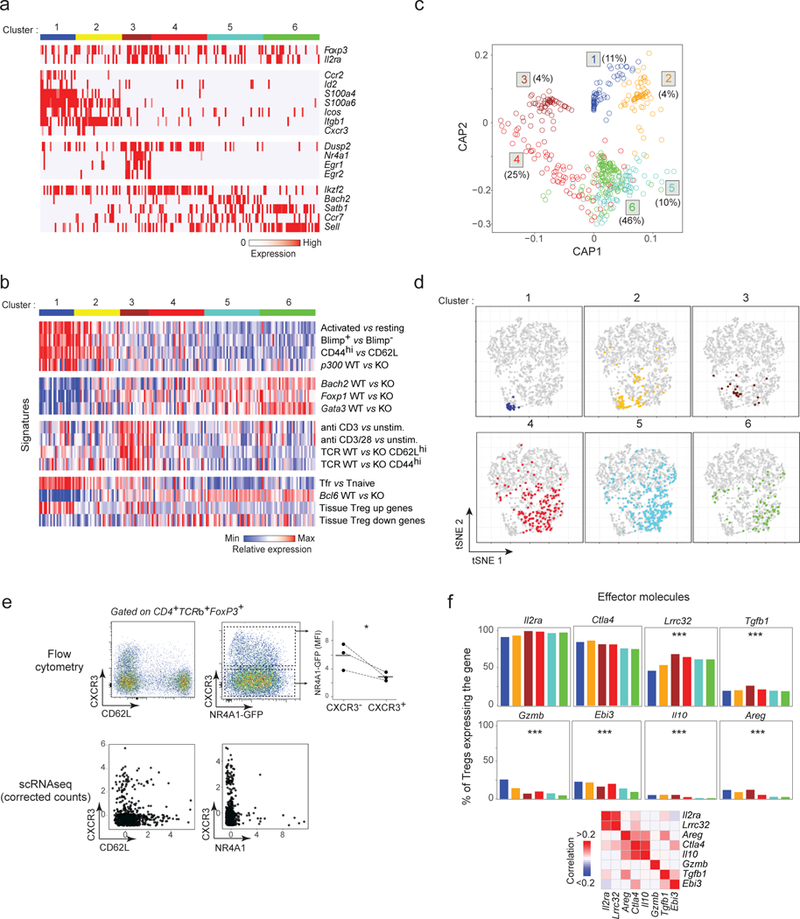
a. Biclustering heatmap of the expression of the most characteristic genes for each Treg cluster (down-sampled to equilibrate cluster size; each vertical line represents one cell)
b. Biclustering heatmap of expression signatures in Treg cells belonging to different clusters (cell and clusters aligned with a).
c. Circular a posteriori projection plot (CAP) 40. Each single cell is projected on a circular plan according to its likelihood to belong to any of the 6 clusters defined in a (n = 708). The proportion of cells in each cluster is indicated.
d. Same tSNE plots as in Fig. 2a, highlighting the location of individual Treg cells from each of the Treg clusters.
e. Cxcr3, Cd62l and Nr4a1 expression in single Treg cells determined by flow cytometry (top row, representative of 3 experiments) or by scRNAseq (corrected counts, bottom row). Top right: Nr4a1-GFP expression in CXCR3− and CXCR3+ Tregs (as gated),* p < 0.05 (t-test).
f. Proportion of cells in each Treg cluster (defined in a) that express different effector transcripts. Proportion calculated after correction for dropout events (see Methods). *** p < 10−4 (ANOVA).