
Figure 6. Tregs that express the same TCRαβ sequence have related transcriptional programs.
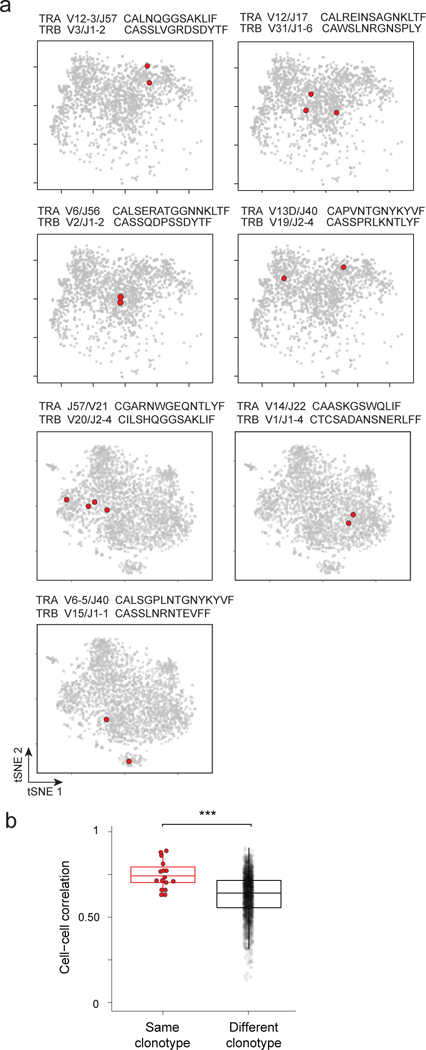
a. Two-dimensional tSNE plot of Tregs from the colon lamina propria, in 7 panels to highlight in red single Treg cells with the same rearranged TCRαβ sequences. V/J alleles and CDR3 sequences indicated above each panel. Data from 2 different experiments (top 4 and bottom 3 panels).
b. Cell-cell correlation between colonic Treg cells that express the same rearranged TCRαβ, or unrelated TCRs , *** p < 10−4 (t test p value).