Table 1.
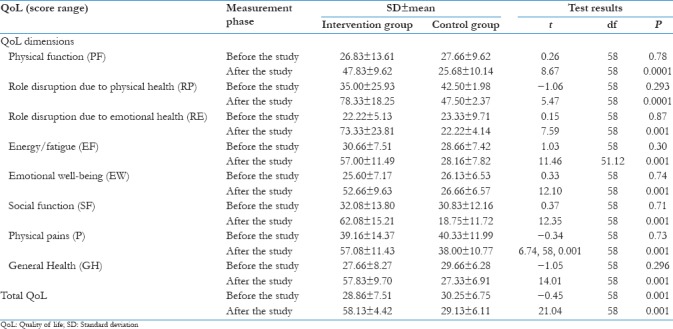
Comparing the mean of quality of life dimensions and total quality of life before and after the study in the intervention and control groups

Comparing the mean of quality of life dimensions and total quality of life before and after the study in the intervention and control groups
