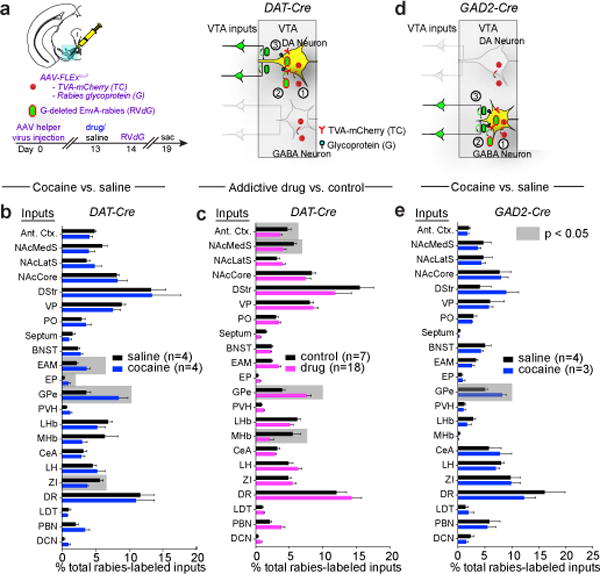
Figure 1. Cocaine-induced changes to VTA neuron inputs.

a, Strategy for labeling inputs to VTA-DA neurons. b, Fraction of total GFP+ inputs from each site relative to total quantified inputs. Highlighted regions represent p < 0.05 (p = 0.04, 0.04, 0.02, 0.02 for EAM, EP, GPe, and ZI, respectively). c, Combined data for administration of drug of abuse (n = 4, 5, 5, 4 for cocaine, amphetamine, morphine, and nicotine, respectively) or control (saline, n = 4; fluoxetine, n = 3: p = 0.005, 0.007, 0.05, 0.05 for GPe, MHb, NAcMedS, and Ant. Ctx., respectively). d, e, Strategy (d) and quantification (e) of labeling inputs to ventral midbrain GABA neurons (GPe, p = 0.01). In this and subsequent figures, unless otherwise noted, all statistical analyses used paired t-tests, and error bars represent SEM. See Methods for abbreviations of anatomical terms. The schematics of the mouse brain in this figure were adapted from ref. 33.
