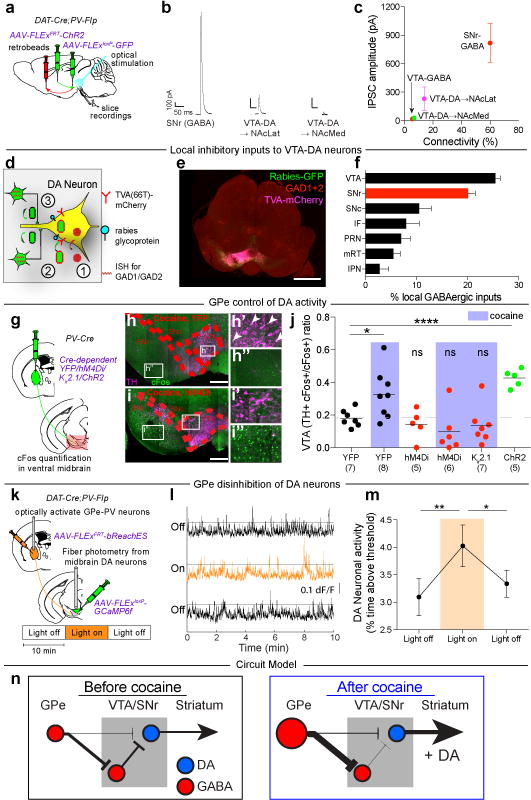
Figure 5. GPe-PV neurons disinhibit VTA-DA neurons.

a, AAV-FLExFRT-ChR2 was injected into GPe, AAV-FLExloxP-GFP injected in VTA, and retrobeads injected into NAcLatS or NAcMedS of DAT-Cre;PV-Flp or GAD2-Cre;PV-Flp mice. Whole-cell recordings were made from identified midbrain neurons in acute slices. b, Example light-evoked IPSCs. c, Quantification of percent connectivity and IPSC amplitude for each cell type. d, AAV-FLExloxP-TC66T and AAV-FLExloxP-G were injected into VTA of DAT-Cre mice, followed two weeks later by RVdG. e, Sample labeling of midbrain section (scale = 1 mm). f, Quantification of labeled local inhibitory inputs. g, Cre-dependent AAVs expressing YFP, hM4Di, Kir2.1, or ChR2 were injected into GPe of PV-Cre mice followed by quantification of Fos labeling. h, i, Sections of ventral midbrain showing Fos labeling (green) and tyrosine hydroxylase (TH) labeling (magenta) in animals receiving cocaine injections and expressing YFP (h) or hM4Di (i) in GPe. Arrows indicate Fos+ neurons co-expressing TH (scale = 200 μm). j, Quantification of activated DA neurons (Fos+ TH+) relative to all activated ventral midbrain neurons (Fos+) (cocaine-YFP, p = 0.029; ChR2, p < 0.0001). k, Flp-dependent bReachES was injected in GPe and a Cre-dependent GCaMP6f was injected in VTA of DAT-Cre;PV-Flp mice. l, Fiber photometry traces during consecutive 10 min epochs. m, VTA-DA neurons were more active during light-on than light-off (one-way ANOVA, p = 0.014; post-hoc tests 0-10 vs. 10-20 min, p = 0.008; 10-20 vs. 20-30 min, p = 0.039). n, Proposed circuit diagram before and after cocaine. Size of cell body and arrows represent activity strength. The schematics of the mouse brain in this figure were adapted from ref. 33.
