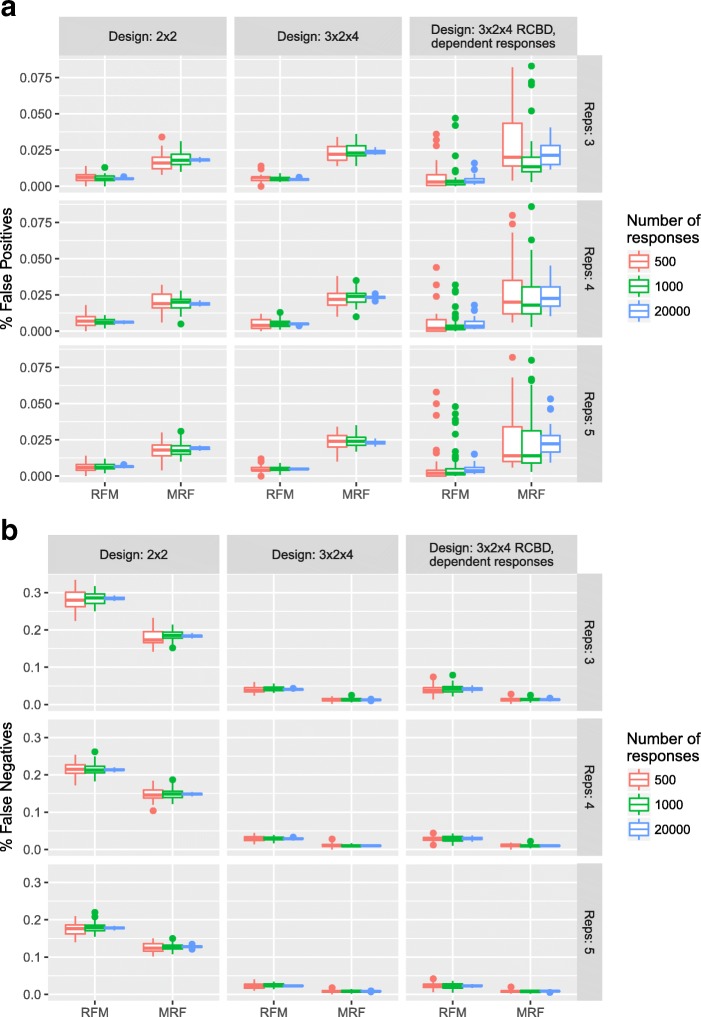
Fig. 3.
Simulation Study: Overall Type I and Type II error. Under a B-H control of the FDR: a Boxplots showing the distribution of the percentage of responses (within a dataset) falsely identified as having non-constant mean response and b Boxplots showing the distribution of the percentage of responses (within a dataset) falsely identified as having a constant mean response over all treatment groups

