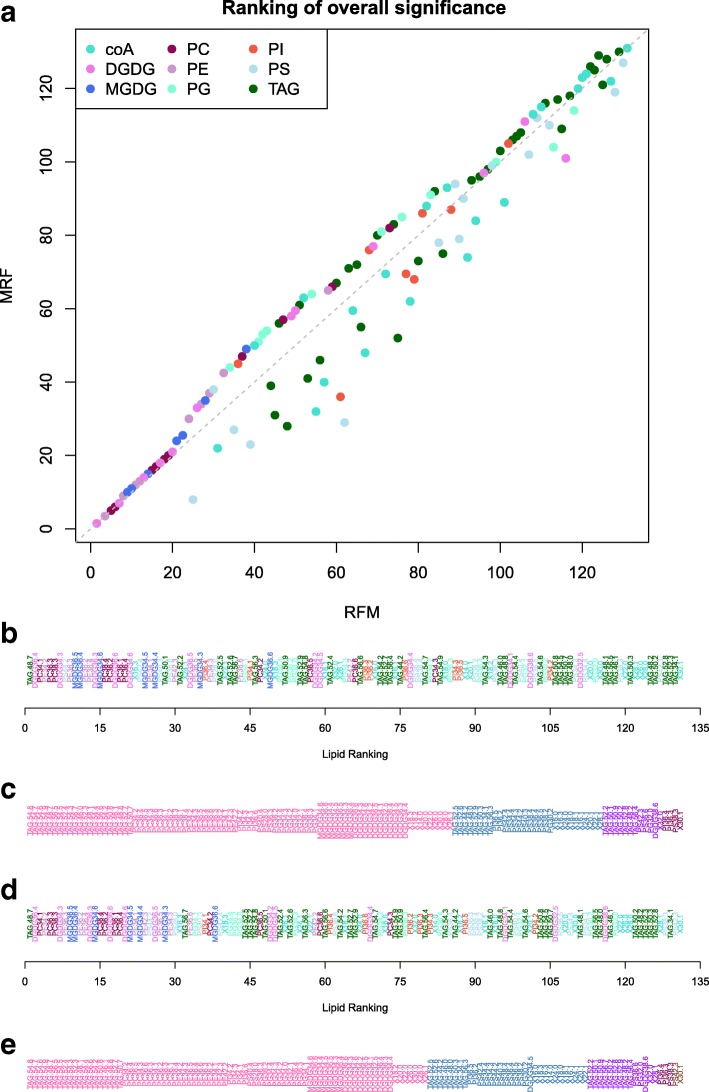
Fig. 5.
Lipidomics Case Study: Overall Comparison. a Comparison of the ranking of the set of lipid species obtained from the overall measure of statistical significance via the RFM approach compared to the MRF approach. Lipids above the grey dashed line are ranked higher under RFM, whereas lipids below the dashed line are ranked higher under MRF. Colour of points indicates the associated type of each lipid species. b Lipids ranked according to the overall test of significance under MRF (one-way ANOVA of the predictive model). c Lipids grouped according to the set of effects included in the predictive model under MRF. d Lipids ranked according to the overall test of significance under RFM (one-way ANOVA of the saturated model). e Lipids grouped according to the set of effects included in the predictive model under RFM. Information provided in tabular form in Additional file 2 of the Supplementary Material

