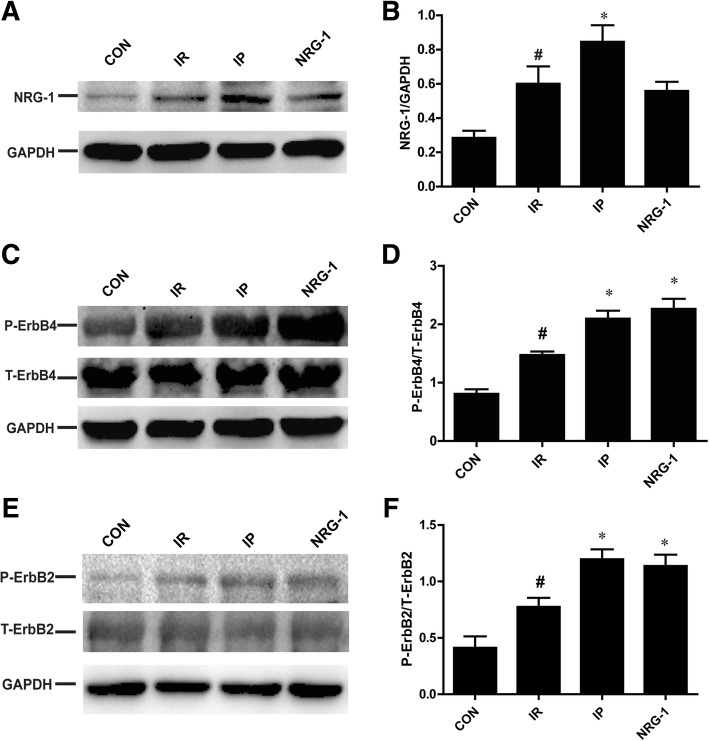
Fig. 2.
Increased NRG-1 and activation of ErbB2/4 by both IP and NRG-1 in vivo. (a), Representative protein levels of NRG-1. (b), Semi-quantification of protein levels of NRG-1. (c), Representative protein levels of P-ErbB4 and T-ErbB4 by western blotting. (d), Semi-quantification of the density ratio of P-ErbB4/T-ErbB4. (e), Representative protein levels of P-ErbB2 and T-ErbB2. (f), Semi-quantification of protein levels of P-ErbB2/T-ErbB2.These protein levels were normalised to GAPDH. CON: control, IR: ischaemia-reperfusion, IP: ischaemic postconditioning, NRG-1: IR + NRG-1. Data are shown as the mean ± SEM (n = 6). # p < 0.05 vs. CON, *p < 0.05 vs. IR

