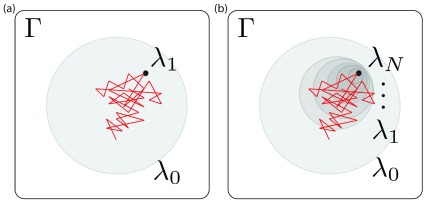
Figure 3. Phase space overlap between the states in a thermodynamic path for removing restraints with λ.
Γ represents the phase space that contains all the configurations for all the states in the path. λ 0 and λ 1 (left) or λ N (right) represent the end states along the path, each shaded region represents a state in phase space and the red lines represent the configurations visited by the simulation run in the λ 0 state. The restrained state is a subset of the unrestrained one. ( a) and ( b) represent simulations with different numbers of intermediate states along the path between a fully restrained state ( λ 1 ( a) or λ N ( b)) and an unrestrained state ( λ 0). In ( a), the simulation (red) only visits very few configurations consistent with the restrained state – i.e, there is poor phase space overlap – indicating a need for more intermediate states, otherwise any free energy estimates will be subject to very high uncertainties; in ( b) there is still almost no overlap between the simulation and states consistent with λ N, but there is overlap with the next shaded region, λ 1, indicating the potential for overlap and accurate free energy estimates. Thus simulations run in each shaded region are more likely to have a bigger phase space overlap with λ N than simulations run in λ 0.

