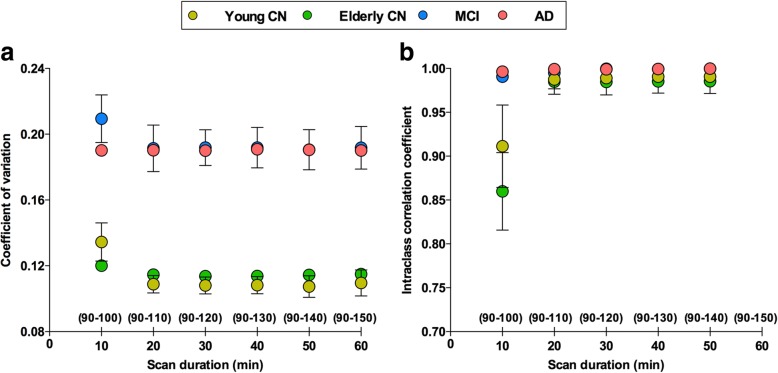
Fig. 5.
SUVRs measured from 90 to 110 min provide reliable [18F]MK-6240 estimates. a Dots and bars represent coefficient of variation (CV) and 95% confidence interval (CI), respectively, assessed for each individual’s regions of interest (ROIs) and averaged within groups using standardized uptake value ratios (SUVRs) measured with different durations after tracer reached equilibrium (90 min, see Fig. 4). b Dots and bars represent intraclass correlation coefficient (ICC) and 95% CI, respectively, performed between SUVRs calculated using progressively longer frames. 95% CI analyses suggested no differences in SUVR estimates measured using acquisitions equal to or longer than 20 min for [18F]MK-6240 scans starting 90 min post injection. CN cognitively healthy, MCI mild cognitive impairment, AD Alzheimer’s disease

