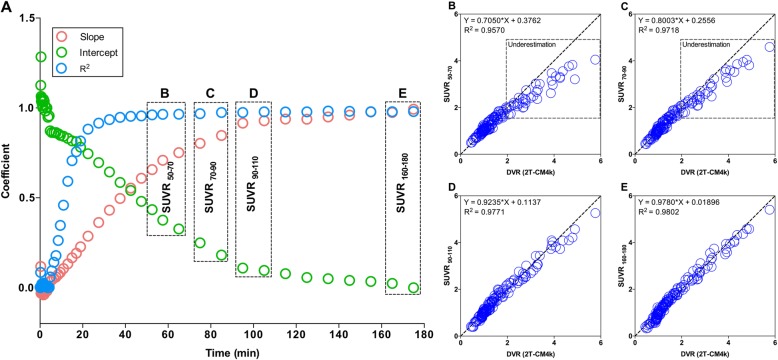
Fig. 6.
SUVRs measured in later time frames had progressively more similar estimates than compartmental analysis. a Dots represent results of regressions between standardized uptake value ratios (SUVRs) obtained from different scan acquisition times and distribution volume ratio (DVR) obtained with reversible two-tissue comportment model (2T-CM4k) across subjects and brain regions. Association between SUVR and 2T-CM4k showed progressively better goodness of fit (R2) and these quantification methods showed progressively more similar estimates (slope closer to 1 and intercept closer to 0) when using progressively later time frames for SUVR calculation. Although strength of the relationship showed constant increase until end of experiment, it approached the asymptote of the curve at 90 min post injection. Scatter plots show association between 2T-CM4k DVRs and SUVRs calculated from (b) 50 to 70 min, (c) 70 to 90 min, (d) 90 to 110 min, and (e) 160 to 180 min. SUVRs calculated before 90 min post injection underestimated 2T-CM4k in regions with moderate and high binding, but not in low binding regions

