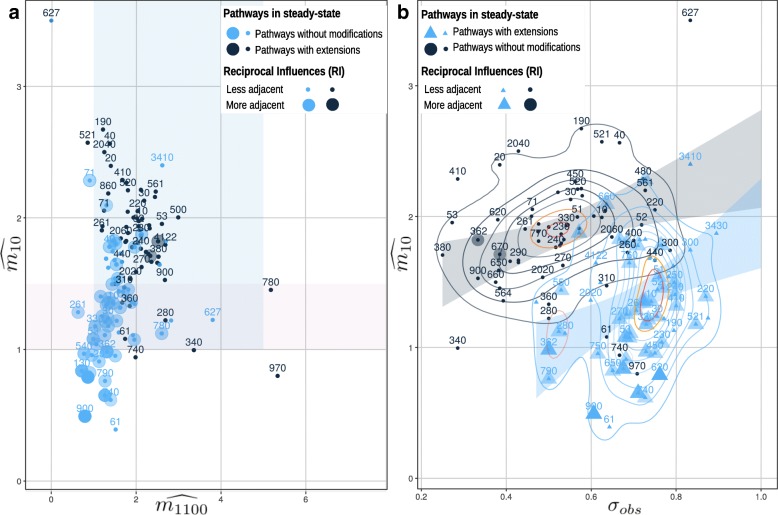
Fig. 6.
The anti-dyadic effect magnitudes (y-axis) and the dyadic effect magnitudes (x-axis) of 66 pathways are shown in Figure a. The pink rectangle underlines the area where the pathways present an anti-dyadic effect , instead the blue rectangle individuates the area where the average dyadic effect is . The pathways with path extensions are shown with blue dots while black dots depict the same pathways without deviations. The number on the dots is the KEGG pathway identifier without its suffix path:eco. In Figure b the anti-dyadic effect is shown on the y-axis and the pattern similarity σobs to an ideal oscillating multi-omic pattern on the x-axis. Black dots describe pathways without extensions, and triangles depict those with extensions. The black and blue curves correspond to the two-dimensional kernel density estimation both for the dots and for the triangles. The plot is clearly separable with a binary classifier, individuating principally two bands (the black and the blue ones). Both the plots show that pathways without extensions have a median reciprocal influence =1±0.27 per node. Instead, pathways with extensions present a median reciprocal influences of =2±0.62 per node. Pathways with extensions present present better MORA reciprocal influences than pathways without extensions. The pathway is presented with a big shape on the plot if the RI is > 1.5 (more adjacent). Opposite, pathways with RI ≤ 1.5 are classified as less adjacent

