Fig. 1.
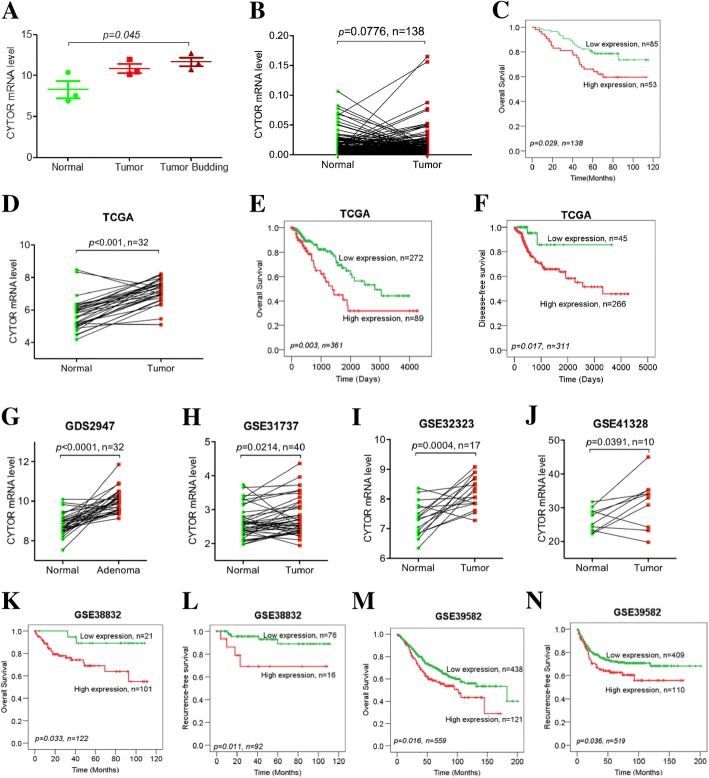
CYTOR up-regulation in CRC samples with poor outcome. a Up-regulation of CYTOR in laser-microdissection-captured tumor budding cells, tumor cells compared with normal epithelial cells, n = 3 (CYTOR level represents the fluorescence signal value from microarray). b Higher expression of CYTOR in CRC samples than the matched normal tissues from our tissue bank, measured by qRT-PCR. c Kaplan-Meier plots of overall survival for CRC samples from our tissue bank, higher CYTOR expression with poorer survival. d Higher expression of CYTOR in CRC samples than the matched normal tissues from the TCGA database. e Kaplan-Meier plots of overall survival and f disease-free survival for CRC samples from the TCGA database, higher CYTOR expression with poorer survival. g Higher expression of CYTOR in CRC samples than the matched normal tissues from the GDS2947, h GSE31737, i GSE32323 and j GSE41328 databases. k Kaplan-Meier plots of overall survival and l recurrence-free survival for CRC samples from the GSE38832 database, higher CYTOR expression with poorer survival. m Kaplan-Meier plots of overall survival and n recurrence-free survival for CRC samples from the GSE39582 database, higher CYTOR expression with poorer survival

