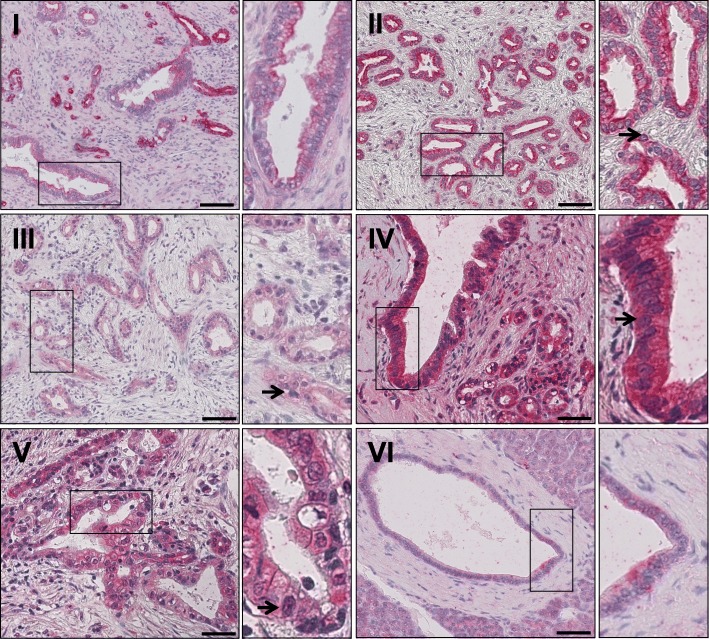
Fig. 1.
Representative images of TRAIL-R1 staining in PDAC tissue (I-V) and non-neoplastic pancreatic duct (VI). I: Tumors with strong cytoplasmic TRAIL-R1 staining in 51–80% cells and no nuclear TRAIL-R1 staining. II: Tumors with strong positive cytoplasm in > 80% cells with negative nuclear staining. III: Tumors with weak positive cytoplasmic staining intensity in > 80% of the cells. Weak positive staining in 10–50% of the nuclei. IV: Tumors with moderate positive cytoplasmic staining in > 80% cells. Weak positive nuclei in 51–80% cells. V: Tumors with moderate positive nuclei in 51–80% of the nuclei. Weak positive cytoplasmic staining in > 80% of the cells. VI: Non-neoplastic duct with weak to moderate positive cytoplasm staining and without positive nuclei. Magnifications corresponding to the rectangles in the large pictures are shown in the small windows. Arrows indicate exemplary nuclear staining. Scale bar marks 100 μm (I – III + VI) or 50 μm (IV – V)

