
Fig. 1.
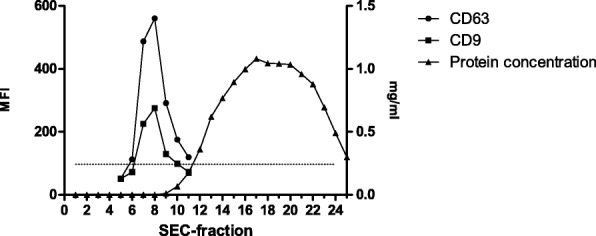
Representative elution profile of uEVs by size-exclusion chromatography (SEC). The expression of CD63 and CD9, depicted as the median fluorescence intensity (MFI, left axis), indicates uEVs presence in SEC fractions. Isotype control is depicted by a dotted line. The total protein content (mg/ml; right axis) was measured in each SEC fraction