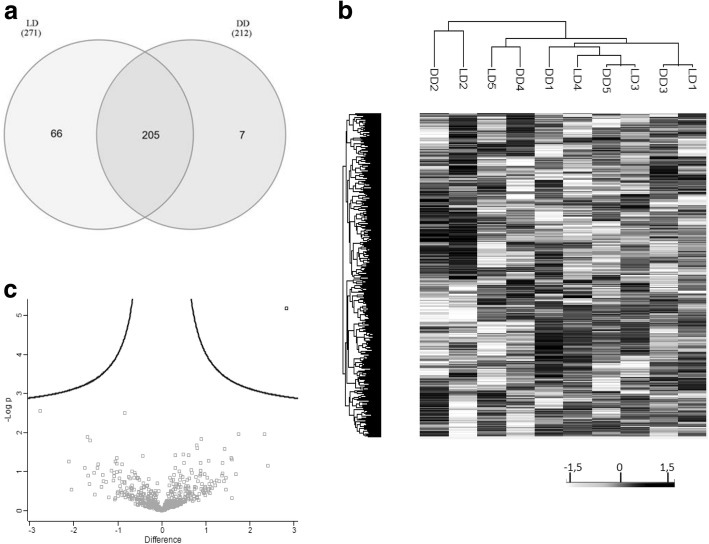
Fig. 3.
miRNA analysis of uEV from living and deceased donor. a Venn diagrams showing the shared and differential miRNA content in uEVs from LD (n = 5) and DD (n = 5) detected by next generation sequencing. 205 miRNAs overlap amongst the different samples analysed of LD and DD. Only the miRNAs shared within all donors of each group were taken for analysis. b Hierarchical clustering analysis of LD and DD uEV samples. Differential analysis of the miRNA content of uEVs from LD and DD. c Scatter plot analysis of miRNAs found in uEVs from LD and DD. Dot plot representing the -log of the p-value and the difference between the miRNA expression of LD and DD groups. Interestingly, only one miRNA was identified as statistically over-represented in LD (in bold, p < 0.05)

