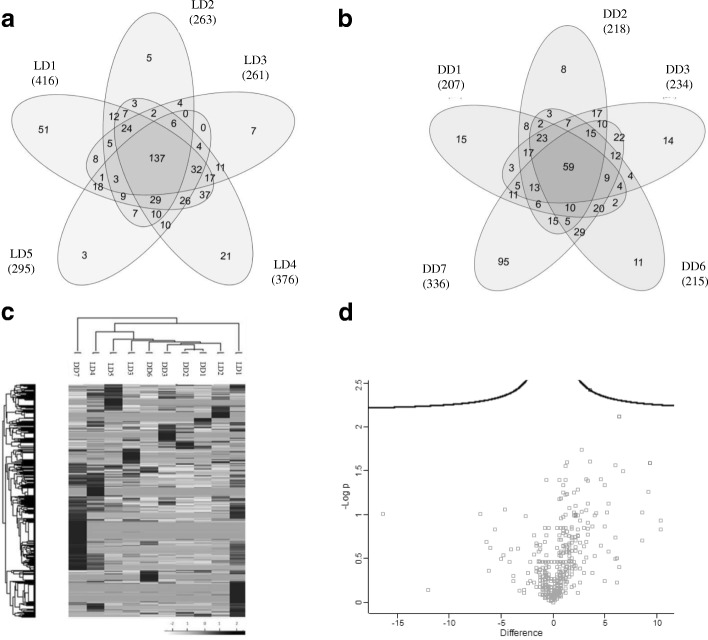
Fig. 4.
Protein analysis uEV from living and deceased donor by LC/MS-MS. Venn diagrams showing the overlap of proteins detected in uEVs from LD (a) and DD (b). c Hierarchical clustering analysis according to the protein content of uEVs from LD and DD. The analysis did not segregate samples in their corresponding group. d Scatter dot plot analysis of the protein content of uEVs from LD and DD. Scatter plot representing the -log of the p-value and the differences between LD and DD group

