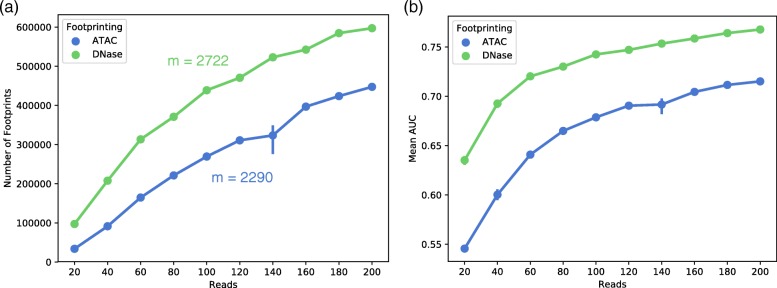
Fig. 2.
The impact of library read depth on number of footprints detected and ChIP-seq recovery as measured by AUC. The number of footprints and biological information of those footprints was calculated in a single downsampled library. Error bars depict the 95% confidence interval around mean values at each downsampling (n = 3). a Number of footprints were measured against read depths at each downsampling. The number of detected footprints increases linearly with read depth. b Mean AUC was measured as a function of downsampled read depth. The increase in AUC with additional reads exhibits a diminishing return per read as read depths increase beyond 100 million reads

