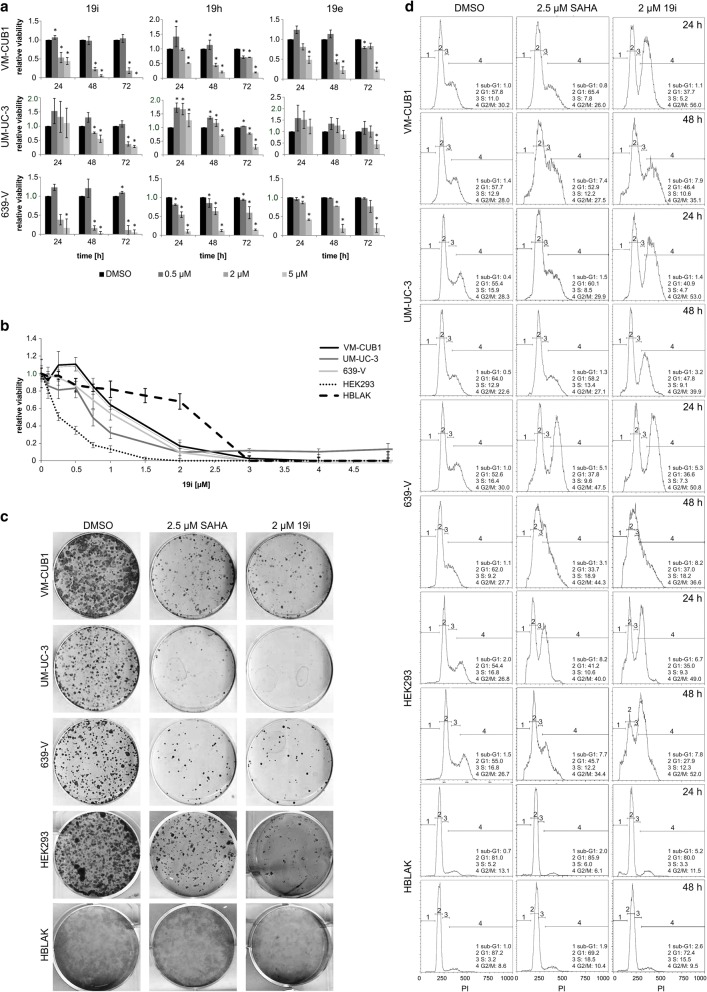
Fig. 1.
Effects of HDACi 19e, 19h, and 19i on urothelial carcinoma and control cell lines. HDACi were applied to UC cell lines VM-CUB1, UM-UC-3, and 639-V as well as control cell lines HEK293 (non-urothelial) and HBLAK (urothelial). a Dose-response curves after 24, 48, and 72 h of treatment of UCCs with 0.5, 2, und 5 μM of each HDACi. The calculated significances refer to the DMSO solvent control (*p < 0.05). Data shown are mean from n = 3. b Dose-response curve of UCCs VM-CUB1, UM-UC-3, 639-V, HEK293, and HBLAK after 72 h of treatment with 0.5–5 μM 19i. Data shown are mean from n = 4. c Clonogenicity following 19i treatment of VM-CUB1, UM-UC-3, 639-V, HEK293, and HBLAK. Cells were treated with DMSO, 2.5 μM SAHA, or 2 μM 19i for 48 h, replated at clonal density, cultured for 2 weeks, and stained with Giemsa. d Changes in cell cycle distribution after 24 or 48 h of treatment with 19i. Cell cycle changes and amount of apoptotic cells (as sub-G1 fraction) determined by flow cytometry following 2 μM 19i or 2.5 μM SAHA treatment in VM-CUB1 UM-UC-3, 639-V, HEK293, and HBLAK. DMSO is the solvent control. Data shown are representative of triplicates

