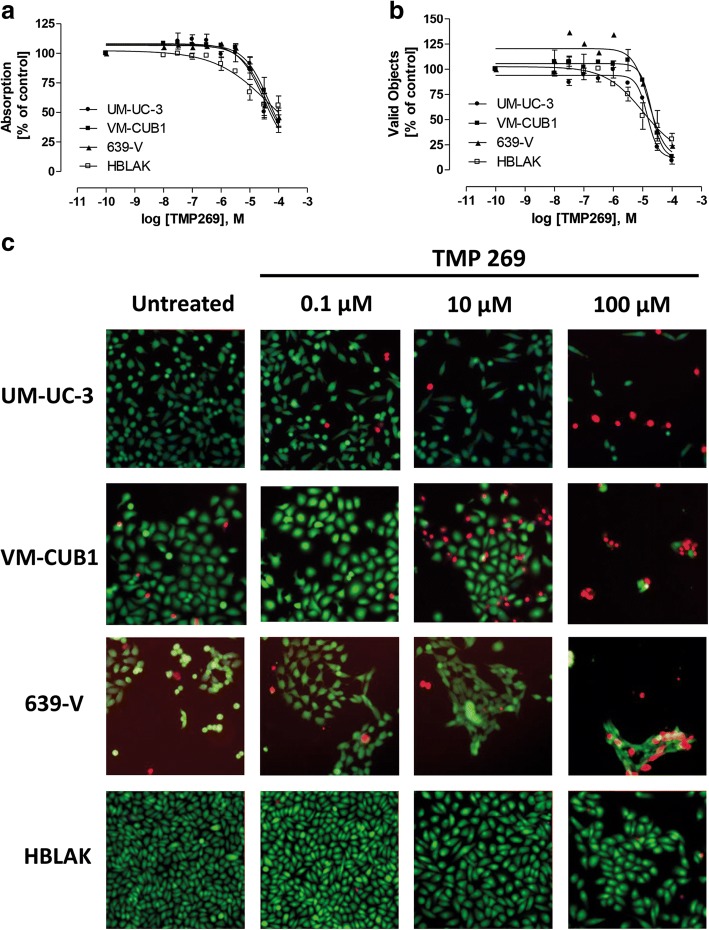
Fig. 7.
Effects of HDACi TMP269 on urothelial carcinoma cell lines. a Concentration-response curves after 72 h of treatment with TMP269 in UCC cells using MTT assays. Data shown are mean ± SEM of the three independent experiments. b Concentration-response curves after 72 h of treatment with TMP269 in UCC cells using high-content analysis-based fluorescent live/dead assay. Data shown are mean ± SEM of the three independent experiments. c Staining of live (calcein-AM, green) and dead (PI, red) UCC cells after 72 h of treatment with TMP269. Data shown are a representative experiment of a set of 3

