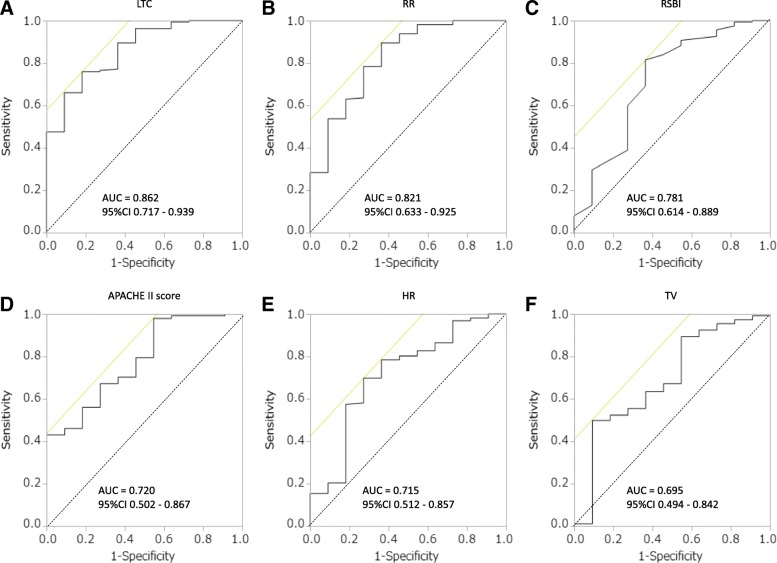
Fig. 3.
ROC curves for LTC (a), RR (b), RSBI (c), APACHE II score (d), HR (e), and TV (f) used to distinguish the success group from the failure group. In the ROC curve analysis, the AUC was highest for LTC (0.862), followed by the RR (0.821), RSBI (0.781), APACHE II score (0.720), HR (0.715), and TV (0.695). ROC curve: receiver operating characteristic curve; LTC: lung-thorax compliance; RR: respiratory rate; RSBI: rapid shallow breathing index; APACHE II score: Acute Physiology and Chronic Health Evaluation II score; TV: tidal volume; AUC: area under the curve, CI: confidence interval

