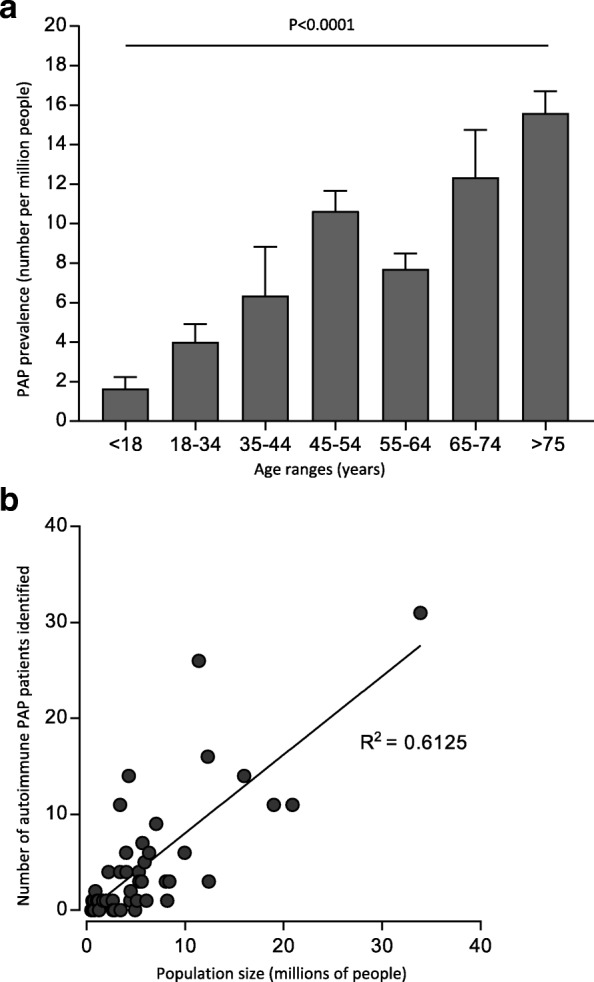
Fig. 1.

Prevalence of PAP syndrome and detection of autoimmune PAP in the United States (US). a Annual prevalence of PAP syndrome was determined retrospectively between January 1, 2008 and December 31, 2012 using data from the OptumInsight health insurance claims database. Bars represent the mean (±SD) prevalence stratified by age (left) or gender (right). Statistical comparisons were done with ANOVA or Student’s t-test, respectively. b Relationship between detection of autoimmune PAP and population size. Autoimmune PAP was identified among individuals with PAP syndrome across the US between 2004 and 2018 by serum GM-CSF autoantibody testing [6] with confirmation by blood-based STAT5 phosphorylation index testing to document impaired GM-CSF signaling [7] at the Translational Pulmonary Science Center in Cincinnati. Data are expressed as the number of individuals with autoimmune PAP by state plotted against the state population obtained from the 2010 US Census [8]. The correlation between GM-CSF autoantibody positive PAP patients and state population size was evaluated by Spearman correlation
