Fig. 2.

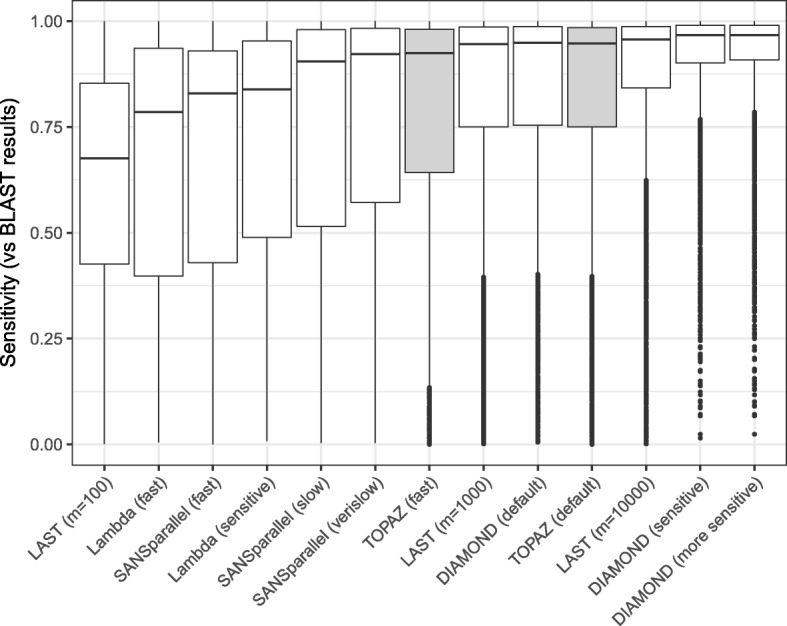
Distribution of sensitivity values per protein compared with BLAST results for each method. Methods are ordered by mean sensitivity. TOPAZ modes are highlighted in grey

Distribution of sensitivity values per protein compared with BLAST results for each method. Methods are ordered by mean sensitivity. TOPAZ modes are highlighted in grey