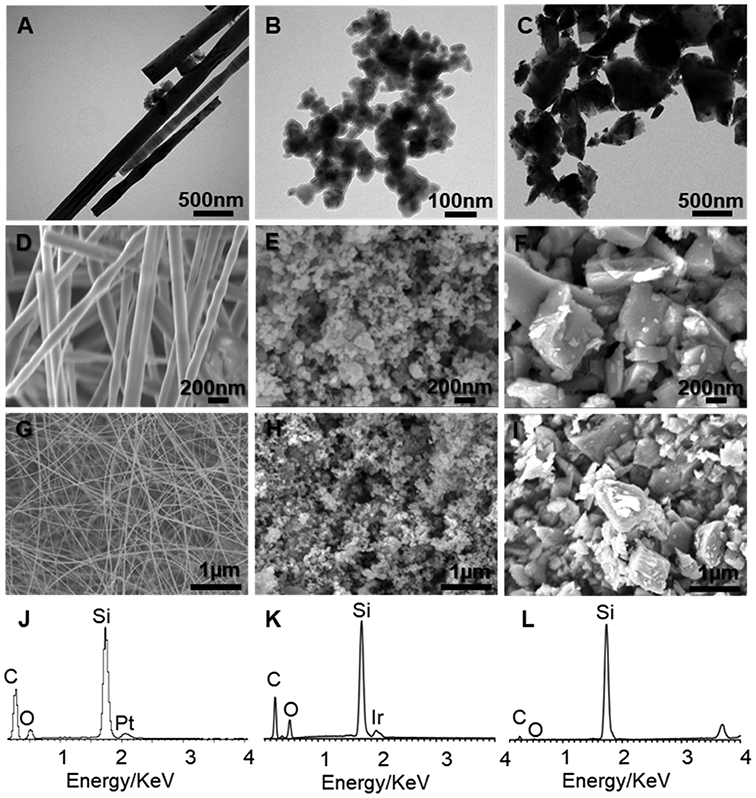
Figure 1.

Characterization of SiC nanomaterials. TEM images of (A) SiCNW and SiCNP with an average size of around (B) 80 nm (SiCNP80) and (C) 600 nm (SiCNP600). SEM images of (D, G) SiCNW and (E, H) SiCNP80 and (F, I) SiCNP600. The width of SiCNW is around 80 nm. EDX spectra of (J) SiCNW, (K) SiCNP80, and (L) SiCNP600 show the presence of silicon, carbon, and oxygen. The oxygen in the EDX spectra is due to the oxidation of the SiC nanomaterials surface. The Pt and Ir stem from the coatings for SEM sample preparation.
