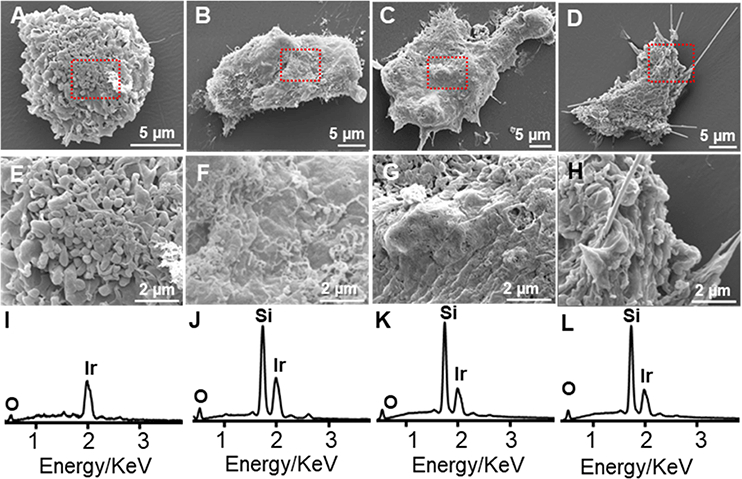
Figure 3.

SEM and EDX of hMSCs. SEM images of (A) unlabeled hMSCs, (B) hMSCs labeled with SiCNP80, (C) SiCNP600, and (D) SiCNWs. Images (E-H) are enlarged areas from the rectangles in (A-D) respectively. EDX spectra of (I) unlabeled hMSCs, (J) hMSCs labeled with SiCNP80, (K) SiCNP600, and (L) SiCNWs. Cells labeled with SiC nanomaterials show a Si peak while the unlabeled hMSCs have no Si peak. Iridium peaks are due to the coatings for SEM sample preparation.
