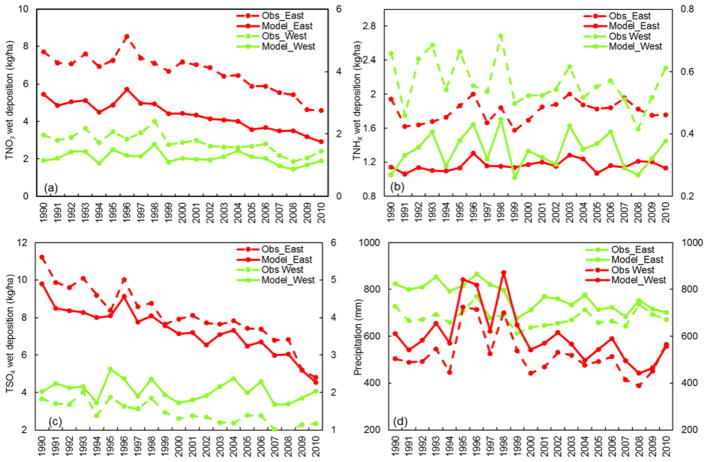
Figure 2.
Comparison of the temporal trends for the annual accumulated WDEP (across all the 170 valid sites) of (a) TNO3, (b) TNHX, (c) TSO4, and (d) annual accumulated precipitation, for the eastern US (green, averaged over 141 sites) and western US (red, average over 29 sites) between observation (dashed lines) and annual precipitation-adjusted model values (solid lines). The scale shown on the left is for the eastern US, and on the right for the western US.

