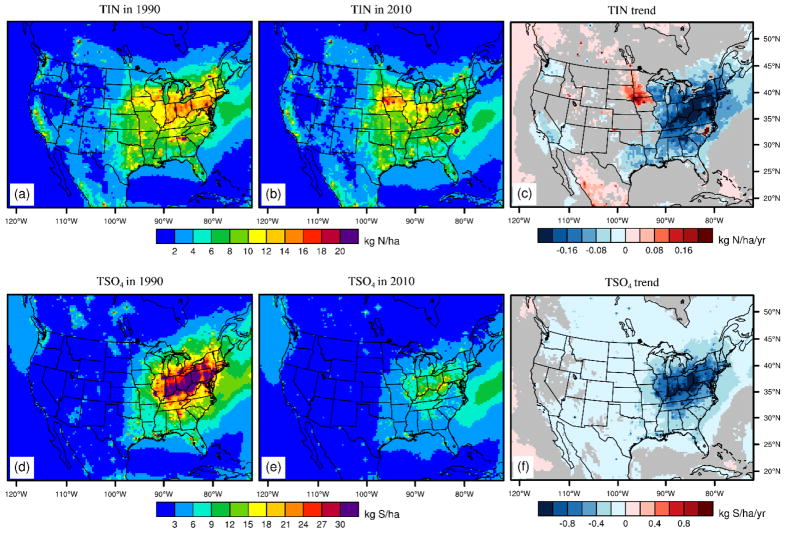
Figure 4.
Spatial distribution of annual TDEP of total inorganic nitrogen (TIN, kg N/ha, top panel) and sulfur (kg S/ha, bottom panel) in 1990 (a, d), 2010 (b, e), and the simulated trends of the TIN (c, kg N ha−1 yr−1) and total sulfur (f, kg S ha−1 yr−1) TDEP changes over the 2 decades. Grey areas on the right plot show p value for the standard two-tailed Student T-test greater than 0.05 (i.e. areas where trend estimates were not significant at the 95% confidence level).

