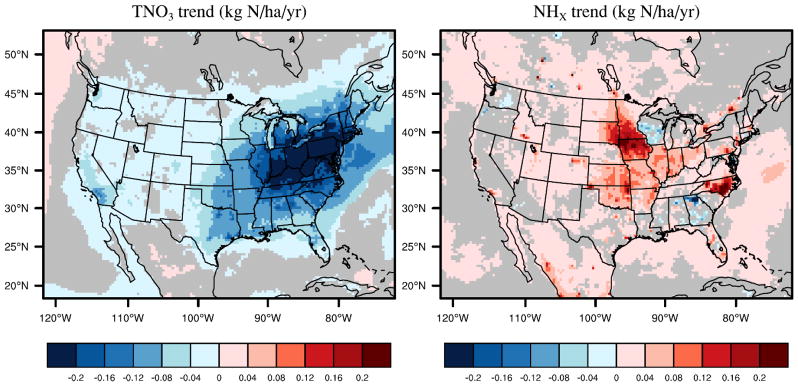
Figure 5.
Spatial distribution of the trends for the TDEP of total reduced nitrogen deposition (TNO3 on the left), and oxidized nitrogen (NHX on the right) from 1990 to 2010. Grey areas on the right plot show p value great than 0.05 for the standard two-tailed Student T-test (i.e. areas where trend estimates were not significant at the 95% confidence level).

