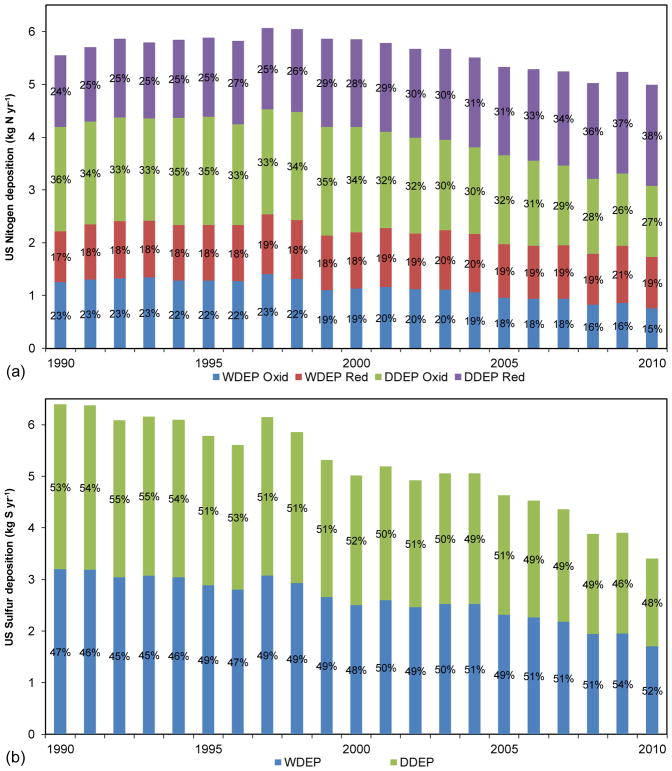
Figure 8.
Interannual variability of the TDEP for inorganic nitrogen (a), and sulfur (b) in the US from 1990 to 2010, including their fractions (WDEP of oxidized nitrogen, WDEP of reduced nitrogen, DDEP of oxidized nitrogen and DDEP of reduced nitrogen deposition for the nitrogen, and WDEP versus DDEP for sulfur).

