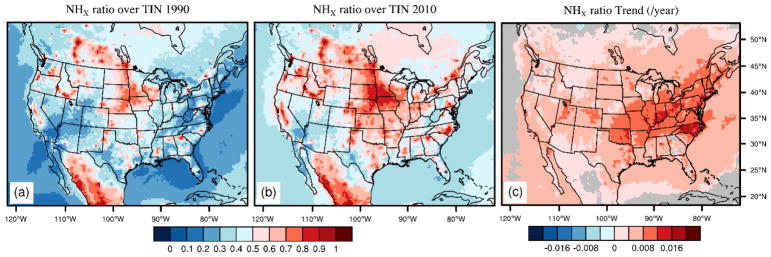
Figure 9.
The ratio of TDEP of NHX over the TDEP of TIN in 1990 (a), 2010 (b), and the trend (c). The blue color in (a,b) indicates an NHx ratio less than 0.5 which means TNO3 dominates the total nitrogen deposition, while the red color indicates a ratio larger than 0.5, and NHX dominates the total nitrogen deposition.

