Figure 2.

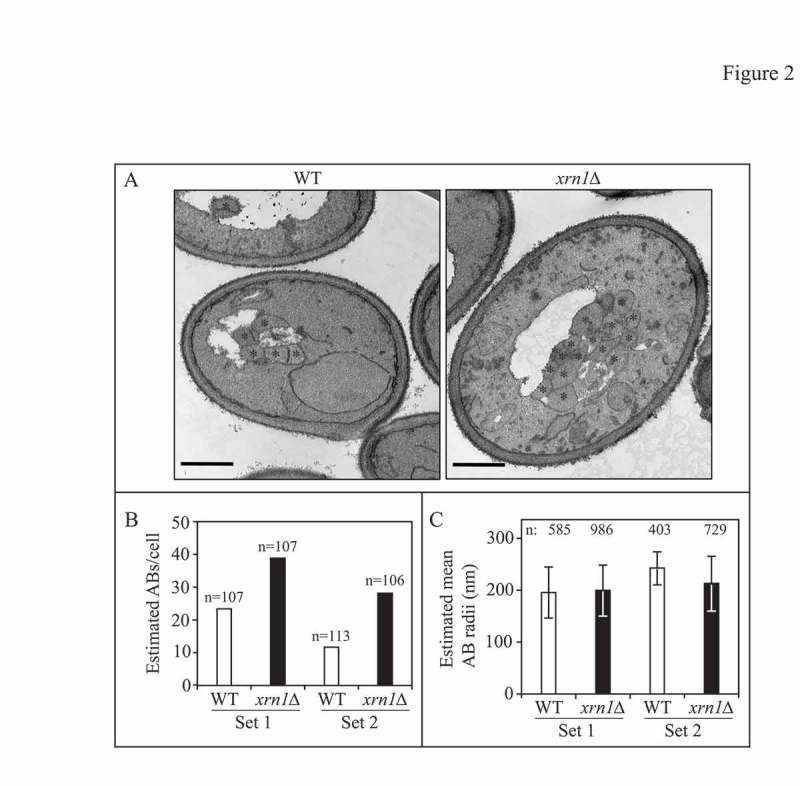
Loss of XRN1 increases autophagosome formation frequency. (A) Representative TEM images showing enhanced accumulation of autophagic bodies (ABs) in xrn1∆ cells (EDA117) compared to WT cells (FRY143) from 2 independent experiments after 2 h in SD-N. Asterisks indicate autophagic bodies. Scale bar: 500 nm. (B) Estimated average number of autophagic bodies per cell. Estimation was based on the number of autophagic body cross-sections observed by TEM [38]. Over 100 unique cells were captured and analyzed per strain for each independent experiment. (C) The estimated mean radii (in nm) of the original autophagic bodies observed by TEM in WT and xrn1∆ cells was analyzed as described previously [38]. Over 400 unique autophagic bodies were captured and analyzed per strain for each independent experiment. Also see Figure S1 and Table S2.
