Figure 4.

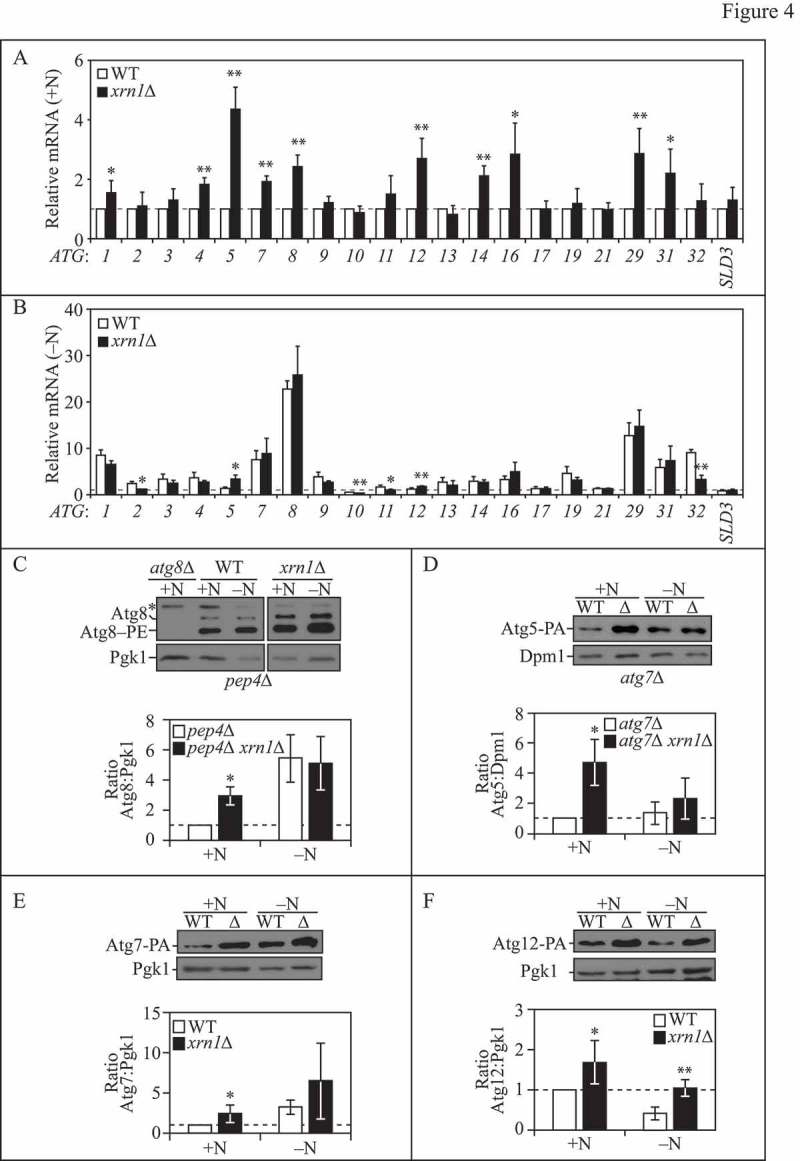
Xrn1 represses the transcription of select ATG mRNAs under nutrient-rich conditions. (A) WT (WLY176) and xrn1∆ (EDA62) cells were grown to mid-log phase in YPD (+N). Total RNA was extracted and RT-qPCR was performed. Results are shown relative to the level of mRNA expression in WT cells under rich conditions (+N), which was set to 1. TFC1 was used to quantify relative expression levels. Results shown are the mean of at least 3 independent experiments. (B) WT (WLY176) and xrn1∆ (EDA62) cells were nitrogen starved (-N) for 1 h. Total RNA was extracted and analyzed as in (A). (C) (Top) Loss of XRN1 enhances Atg8 protein expression. WT (pep4∆; TVY1), atg8∆ (YAB369) and xrn1∆ (EDA84) cells were grown to mid-log phase in YPD and then nitrogen starved (SD-N) for 0 or 1 h. Protein extracts were analyzed by SDS-PAGE and blotted with anti-Atg8 or anti-Pgk1 (loading control) antisera (* denotes nonspecific band). The blots shown are representative of 3 independent experiments. (Bottom) Densitometry of blots represented on the top. The ratio of total Atg8 (sum of Atg8 and Atg8–PE species):Pgk1 was quantified with ImageJ. (D-F) (Top) Loss of XRN1 enhances Atg5 (D), Atg7 (E) and Atg12 (F) protein expression. WT (atg7∆, D; JMY104, E; JMY099, F) or xrn1∆ (EDA129, EDA87 or EDA86) cells were grown to mid-log phase in YPD and then nitrogen starved (SD-N) for 0 (+N) or 2 h (-N). Protein extracts were analyzed by SDS-PAGE and blotted with anti-PA, anti-Dpm1 (D) or anti-Pgk1 (E, F; loading controls) antisera. The blots shown are representative of at least 3 independent experiments. (Bottom) Densitometry of blots represented on the top. The ratio of PA:Dpm1 (D) or PA:Pgk1 (E, F) was quantified with ImageJ. In graphs (A-F), results shown are the mean +/− SD. Also see Table S3.
