Figure 5.

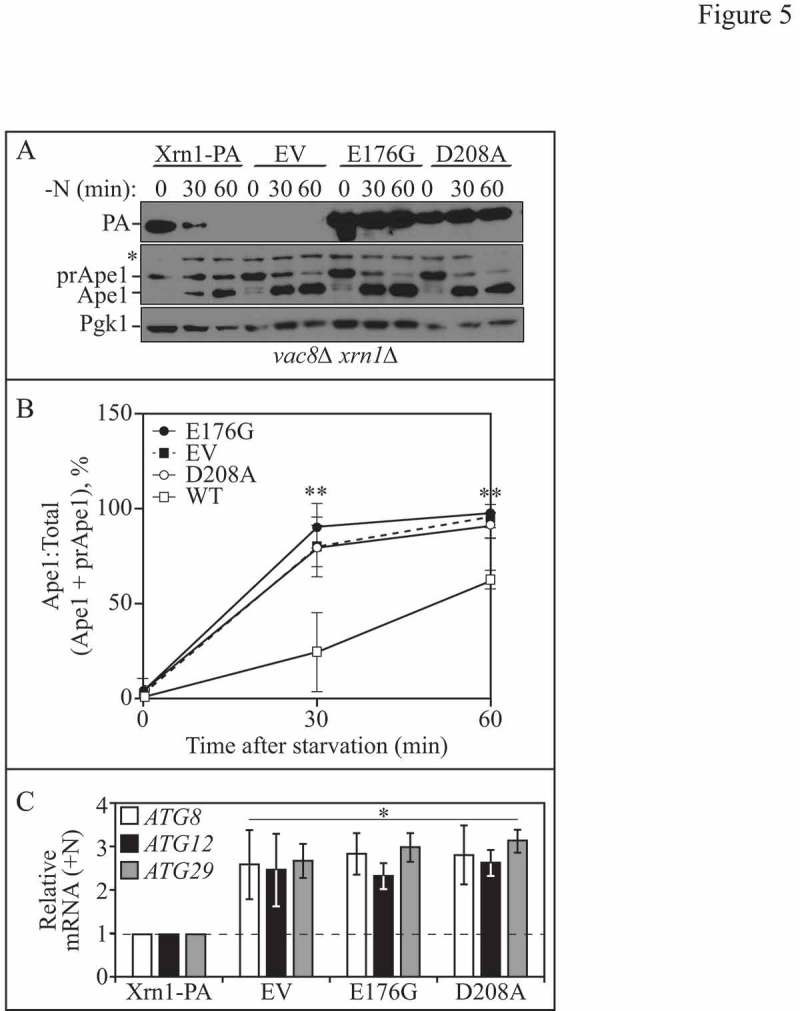
The ribonuclease activity of Xrn1 is required for autophagy regulation. (A) Lysates were collected from vac8∆ xrn1∆ cells expressing a chromosomally integrated plasmid encoding WT Xrn1-PA (EDA147), empty vector (EV, pRS406; EDA142), or catalytically inactive Xrn1E176G-PA (EDA148) or Xrn1D208A-PA (EDA149), which were nitrogen starved for 0, 30 or 60 min. Protein extracts were analyzed by SDS-PAGE and probed with anti-PA, anti-Ape1 or anti-Pgk1 (loading control) antisera (* denotes nonspecific band). The blots shown are representative of 3 independent experiments. (B) Densitometry of blots represented in A. The ratio of Ape1:total Ape1 (sum of prApe1 and Ape1) was quantified with ImageJ. The one-way ANOVA with Dunnett's multiple comparison post-hoc test was used to determine statistical significance. Results shown are the mean +/− SD. (C) Total RNA was extracted from xrn1∆ cells expressing a chromosomally integrated plasmid encoding WT Xrn1-PA (EDA134), empty vector (EV, pRS406; EDA133), Xrn1E176G-PA (EDA135) or Xrn1D208A-PA (EDA136), and RT-qPCR was performed. Results are shown relative to the level of ATG8, ATG12 or ATG29 mRNA expression in WT cells under rich conditions (+N), which was set to 1. The geometric mean of TFC1 and SLD3 was used to quantify relative expression levels. Results shown are the mean of 3 independent experiments +/− SD. Also see Figure S3 and Table S4.
