
Figure 8.
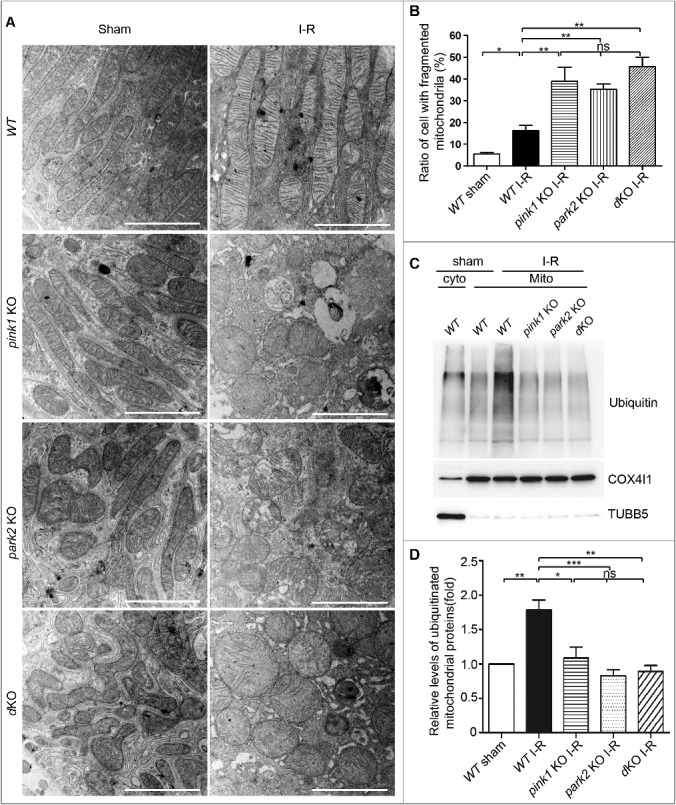
Pink1 and/orPark2 deficiency aggravates renal I-R-induced mitochondrial damage and abrogates renal I-R-induced mitochondrial ubiquitination. (A, B) pink1 KO, park2 KO, pink1 and park2 double-KO(dKO) and WT mice were subjected to renal I-R or sham operation (Sham). Renal cortex was fixed and processed for transmission electron microscopy analysis. (A) Representative TEM images of mitochondrial morphology in proximal tubular cells. Scale bars:2 μm.(B) Quantification of mitochondrial fragmentation. Mitochondrial length was measured in individual tubular cells to determine the percentage of cells in which mitochondria with length> 2 µm was less than 1%. A total of 30 cells in control and 50 cells in ischemic kidneys from 3 animals in each condition were evaluated. (C, D) After renal I-R, renal cortex was collected and fractionated to separate cytosolic (cyto) and mitochondrial (mito) fractions followed by immunoblot analysis of ubiquitin, COX4I1 (mitochondrial marker), and TUBB5 (cytosolic marker). (C) Representative blots. (D) Densitometry of ubiquitin signals. For densitometry, the total signals of ubiquitinated mitochondrial proteins of the sham operation group was arbitrarily set as one in each blot, and the signals of other conditions in the same blot were normalized with the control. Error bars: SEM, n = 3. *p<0.05; **p<0.01; ***p<0.001; ns, not significant.