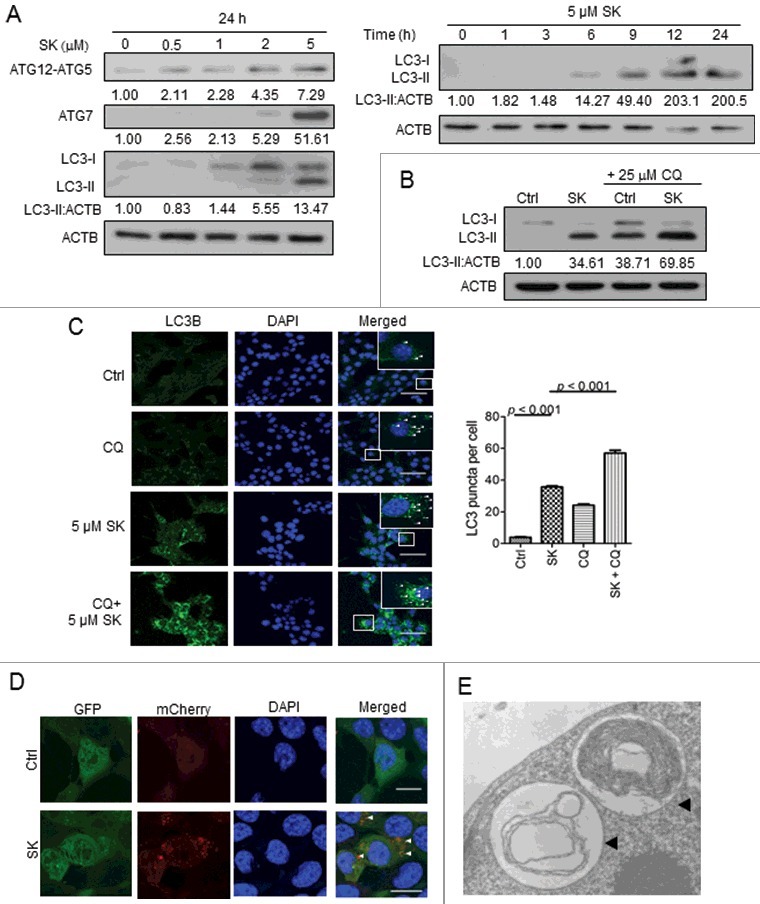
Figure 6.

SK induced autophagy in 4T1-luc2 cells. (A) Effect of SK on the expression of autophagy-related proteins in test cells. Expression of the ATG12–ATG5 complex, ATG7 and LC3B in 4T1-luc2 cells treated with increasing concentrations of SK for 24 h were sequentially analyzed by SDS-PAGE and western blot analysis. The numbers under each strip represent the relative protein densities of each treatment compared to the 0 h control (left panel). Relative expression ratios of LC3-II in cells treated with 5 µM SK were examined in a time course experiment (right panel). (B) Effect of SK on autopagic flux. LC3-I and LC3-II expression in 4T1-luc2 cells treated with 5 µM SK for 24 h in the presence or absence of CQ, determined by western blot analysis. (C) Effect of SK on LC3B expression at the subcellular level. LC3B proteins stained as fluorescent puncta were detected by indirect immunofluorescence using anti-LC3B monoclonal antibody and resolved by confocal microscopy in 4T1-luc2 cells treated with SK as stated above, in the presence or absence of CQ (left column, left panel). Nuclei were stained with DAPI (in blue color, middle column). Subcellular localization of puncta was indicated (right column) and scored. Bar: 60 µm. The puncta (right panel) value indicates the mean SEM scored from at least 30 cells. Data are expressed as mean SEM of triplicate determinations. P values were determined based on a one-way ANOVA analysis with Tukey's test. (D) Effect of SK on autophagic flux as visualized through the expression of mCherry-LC3B-GFP. 4T1-luc2 cells stably expressing transgenic mCherry-LC3B-GFP were subjected to SK treatment as above and resolved by confocal microscopy. Cells expressing mCherry-LC3B or GFP-LC3B are indicated. Subcellular location was assessed by DAPI (in blue). Colocalization of mCherry- with GFP-LC3B puncta is also shown. Bar: 15 µm. Data presented are representative one of 3 different experiments. (E) Subcellular morphology of SK-induced autophagy in test cells. Ultrastructure of 5 µM SK-treated 4T1-luc2 cells was revealed by transmission electron microscopy. The double-membrane structures of autophagosomes (black arrowheads) are indicated.
