
Figure 9.
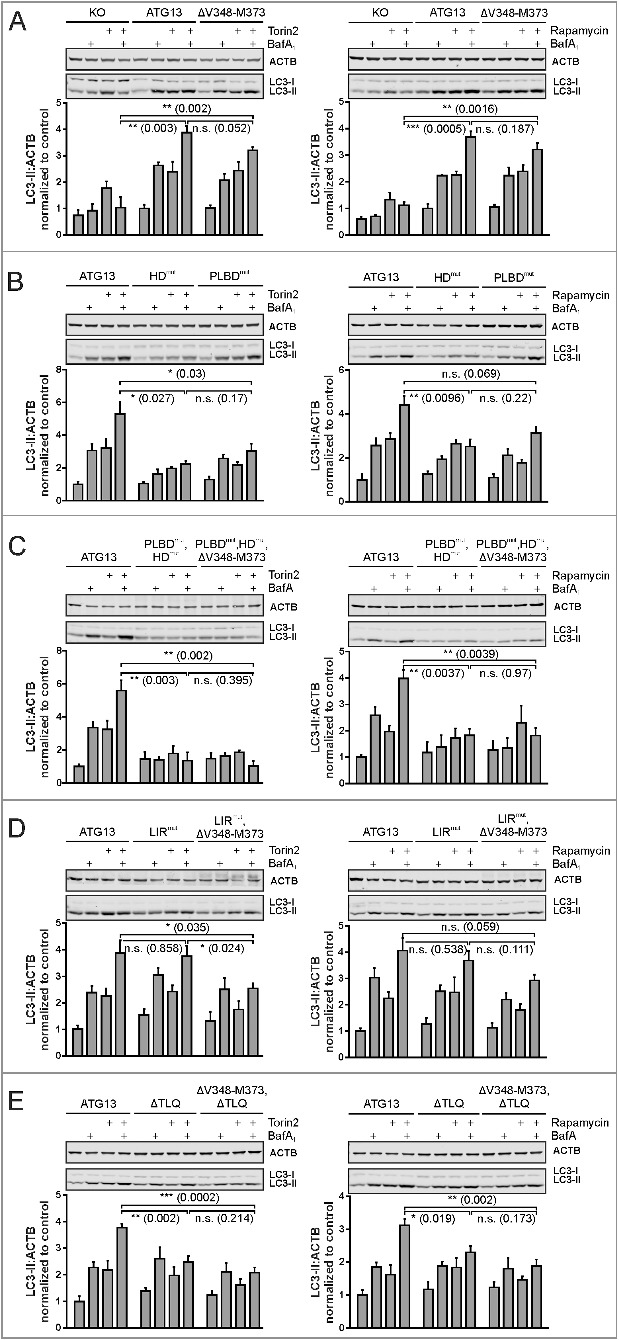
Differential requirement of ATG13 interaction interfaces for autophagy induced by MTOR inhibition. (A to E) atg13 KO MEFs retrovirally transfected with empty vector (KO) or cDNA encoding the indicated ATG13 variants were incubated for 2 h in growth medium in the presence or absence of 250 nM torin2 (left panels) or 500 nM rapamycin (right panels) and 40 nM bafilomycin A1 (BafA1). Cleared cellular lysates were analyzed by immunoblotting for LC3 and ACTB. Fold changes were calculated by dividing each normalized ratio (protein to loading control) by the average of the ratios of the control lane (ATG13 in the medium). Results are mean + SEM *P < 0.05, **P < 0.01, ***P < 0.001 (Student t test, 2-sample assuming unequal variances).