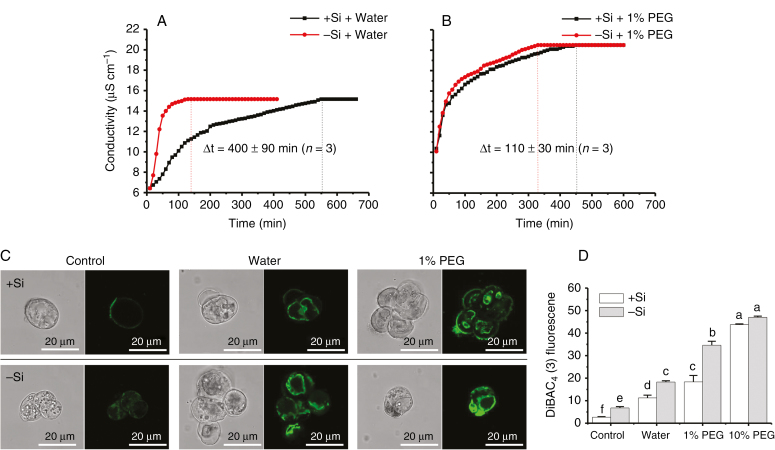
Fig. 4.
Cell membrane stability in the presence of osmotic stress. Plots of conductivity against time in the presence of (A) hypotonicity (in pure water) or (B) hypertonicity (in 1 % PEG solutions). (C) Fluorescence distribution and (D) intensity of –Si and +Si cells using DiBAC4 (3) dye (mean ± SD, n = 3). Different lower-case letters in D show a significant difference at P < 0.05.

