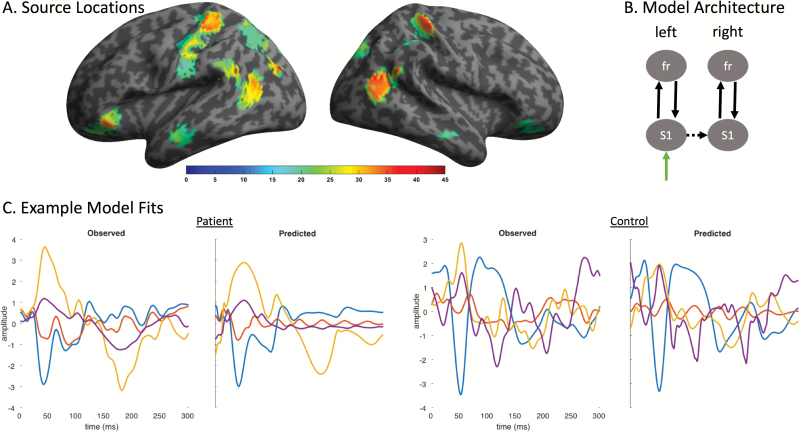
Figure 1.
Source locations, model architecture, and example model fits. (A) Evoked gamma frequency (30–58 Hz) source-localized estimates of the main effect of ketamine for all participants, thresholded at P<.05 corrected. (B) A simple model architecture was used that included subcortical inputs to left primary somatosensory cortex and lateral connections to right primary somatosensory cortex. Forward and backward recurrent extrinsic connections carried signals from S1 to frontal cortex, bilaterally. (C) Example model fits showing measured wide-band (1–42 Hz) virtual electrode signals (observed) from left S1 (blue), right S1 (red), left frontal (orange), and right frontal (purple) sources compared with the estimated signal from the fitted model (predicted).

