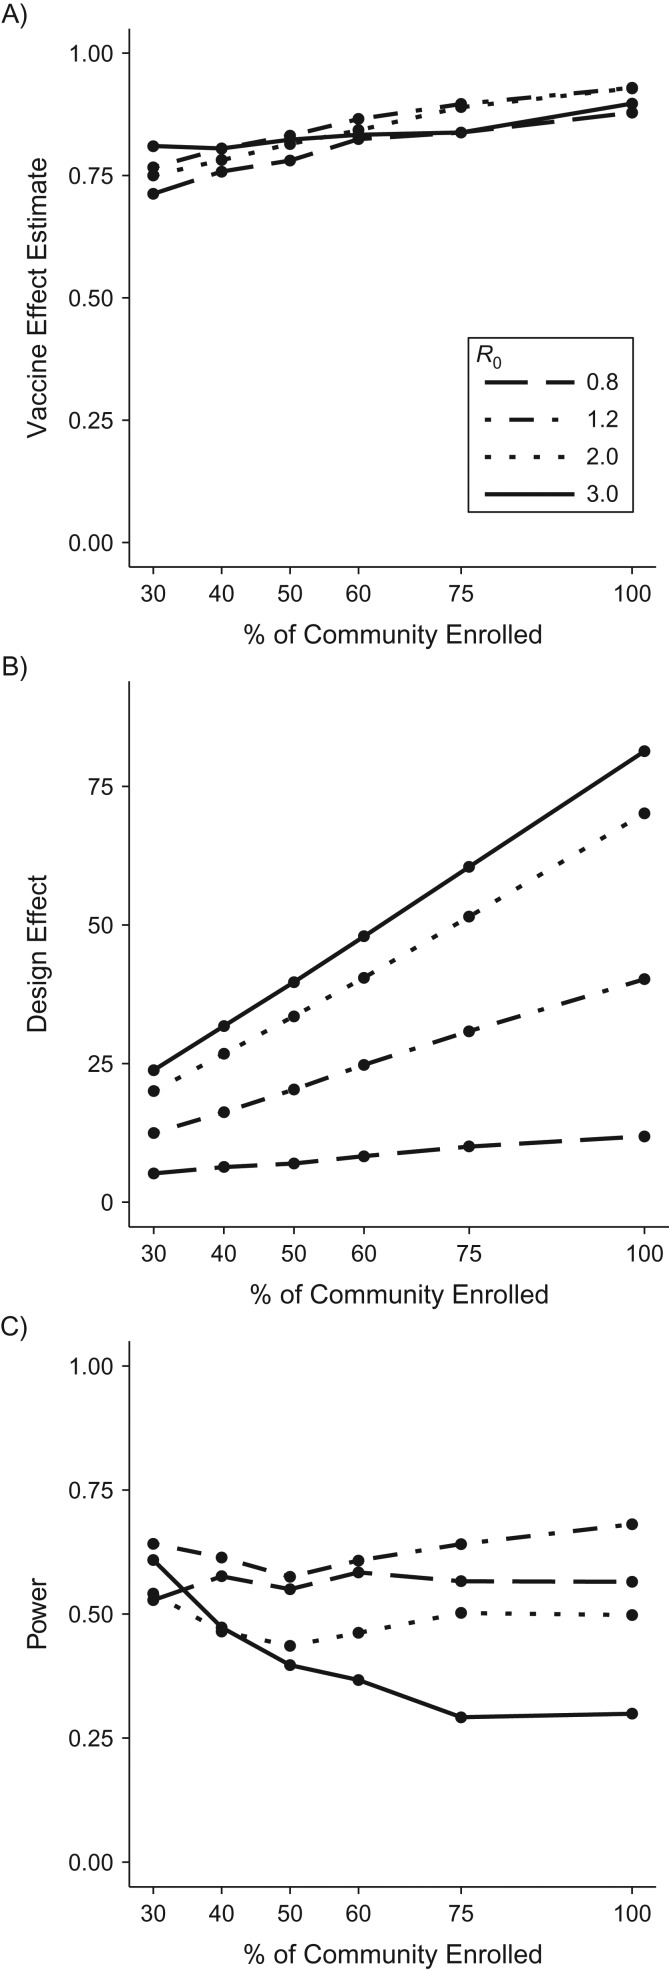
Figure 3.
Relationship between power and community enrollment proportion for a cluster-randomized controlled trial (cRCT), using simulated data. Vaccine effect estimates (A), design effect (B), and power (C) from a cRCT versus the percentage of individuals enrolled from each community, with total sample size held constant and assuming a vaccine efficacy of 60%.

