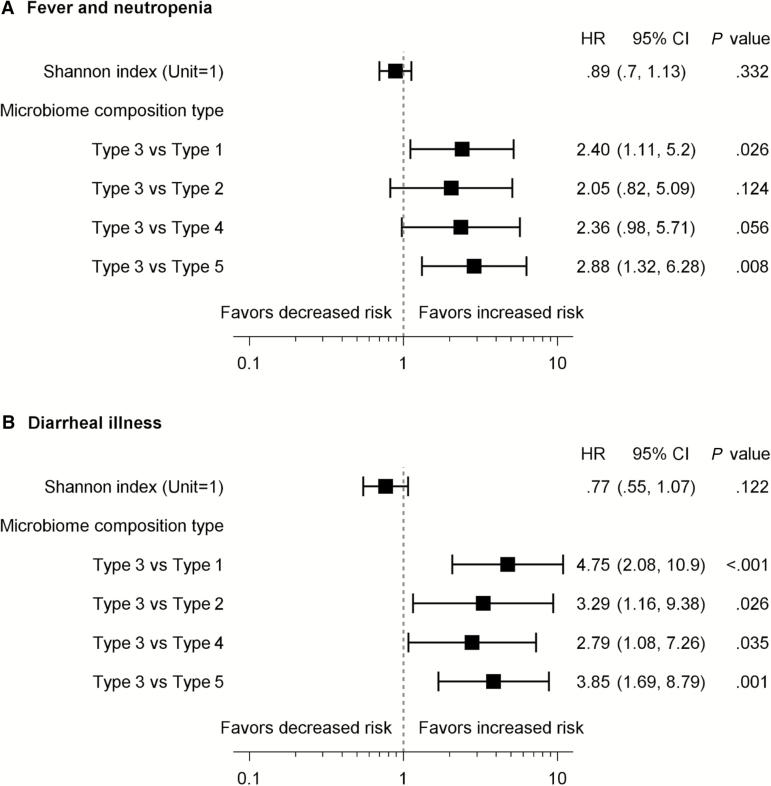
Figure 5.
Forest plot of hazard ratios (HRs) with 95% confidence intervals (CIs) for febrile neutropenia (A) and diarrheal illness (B) associated with gut microbiome composition and diversity at any of the 4 time points. The Anderson-Gill model was used to compare the risk of each outcome among the microbiome Shannon indices and composition types over time. The reported HRs were adjusted for subsequent chemotherapy phase and acute lymphoblastic leukemia risk level, and the 95% CI and P values were estimated using the robust sandwich estimator.

