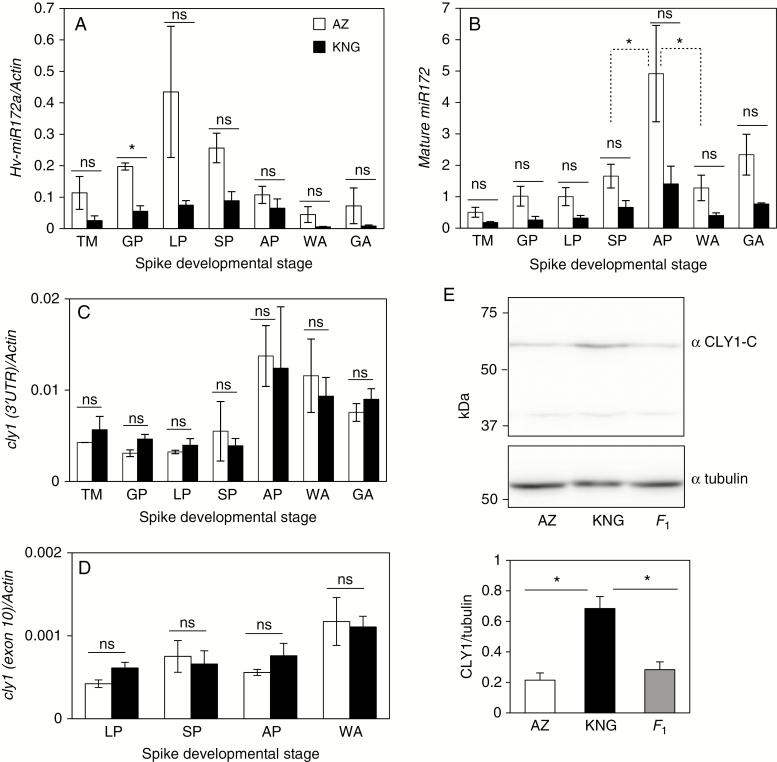
Fig. 2.
Expression of miR172 and cly1. (A–D) qRT–PCR-derived transcript abundance during spike development of (A) primary miR172a (B) mature miR172 (C) cly1 (3′-UTR) and (D) cly1 (exon 10). Actin was the chosen reference sequence. TM, triple mound stage; GP, glume primordium stage; LP, lemma primordium stage; SP, stamen primordium stage; AP awn primordium stage; WA, white anther stage; GA, green anther stage. Comparisons between SP and AP and between AP and WA for AZ are shown by the dashed lines in (B). Mean values for KNG were also significantly different between stages at the 5 % probability level. (E) CLY1 western blotting at the white anther stage (top) and abundance as determined by ratio of CLY1/tubulin abundance (bottom). α CLY1-C, anti-CLY1 C-terminal region; α tubulin, anti-tubulin. Values are mean and s.e. (n = 3 biological replications). *Means are significantly different at the 5 % probability level; ns, not significantly different.

