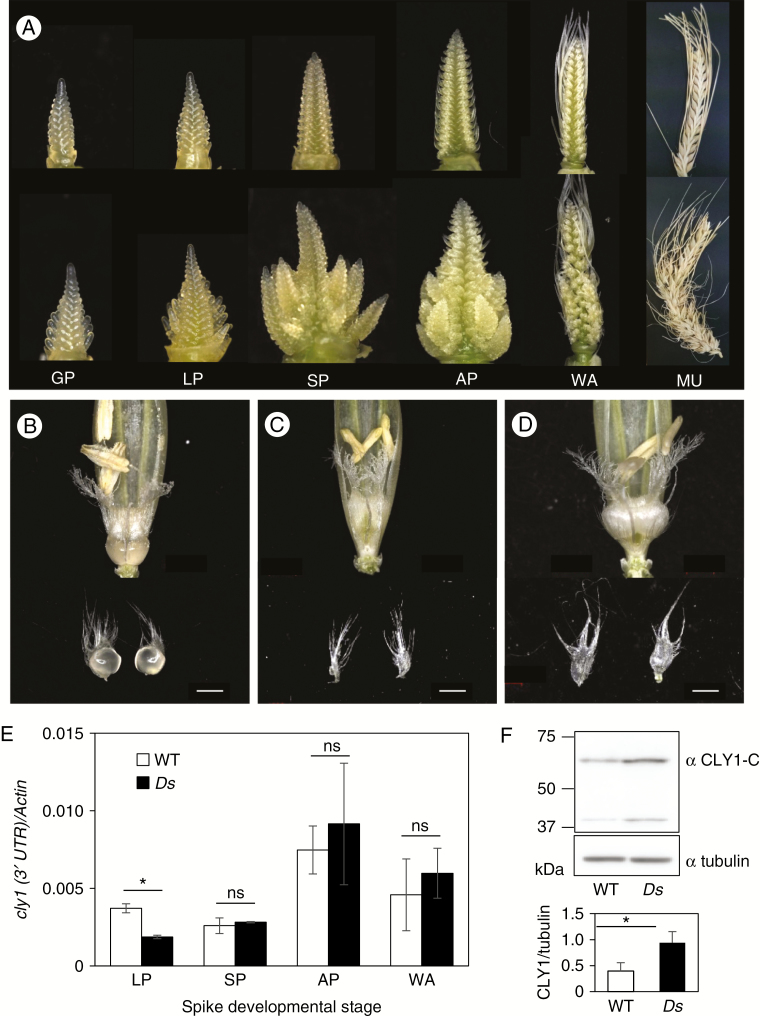
Fig. 5.
Effect of absence of miR172a on inflorescence phenotype and accumulation of CLY1. (A) miR172a/Cly1.a (top) and Ds-miR172a/Cly1.a (bottom) at stages from glume primordium (GP) to maturity (MU). LP, lemma primordium stage; SP, stamen primordium stage; AP, awn primordium stage; WA, white anther stage. (B–D) Variation in lodicule size at anthesis in (B) miR172a/Cly1.a homozygote (C) Ds-miR172a/Cly1.a homozygote and (D) miR172a/cly1.b homozygote. Scale bars = 1 mm. (E) qRT–PCR-derived transcript abundance of cly1. Actin was the reference transcript. (F) Western blot analysis of CLY1 in miR172a/Cly1.a (WT) and Ds-miR172a/Cly1.a (Ds) (top) and abundance as determined by ratio of CLY1/tubulin abundance (bottom). Values in (E) and (F) are mean and s.e. (n = 3 biological replications). *Means are significantly different at the 5 % probability level; ns, not significantly different.

