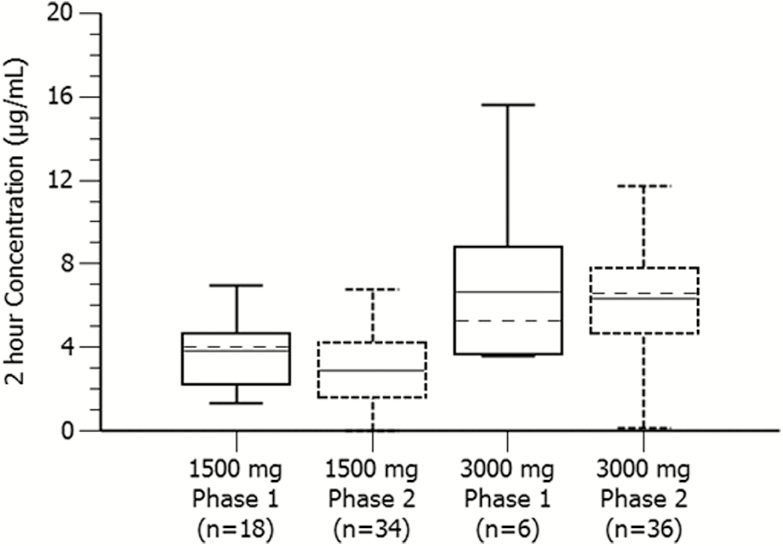
Figure 3.
Comparison of gepotidacin single-dose plasma concentrations at 2 hours postdose between phase 2 participants with gonorrhea and phase 1 healthy volunteers. The solid midline is the mean and the broken midline is the median. The phase 1 data are from a single oral dose under fed conditions for 1500 mg and a single oral dose under fasted conditions for 3000 mg. The 1500-mg and 3000-mg phase 2 data are from the present study, which was a single oral dose administered with food.

