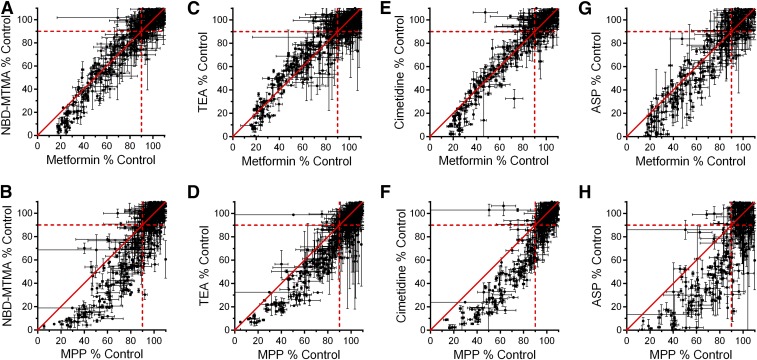
Fig. 5.
Pairwise comparisons of the percentage of remaining OCT2-mediated transport activity (from Fig. 4) for NBD-MTMA, TEA, cimetidine, and ASP (y-axes) vs. the remaining transport activity for metformin (A, C, E, and G) and MPP (B, D, F, and H) (x-axes). The lines of unity are represented by solid red lines, and dashed lines represent 90% of remaining transport activity (top right quadrant is composed of inhibitors that inhibited the transport of both substrates by less than 10%).

