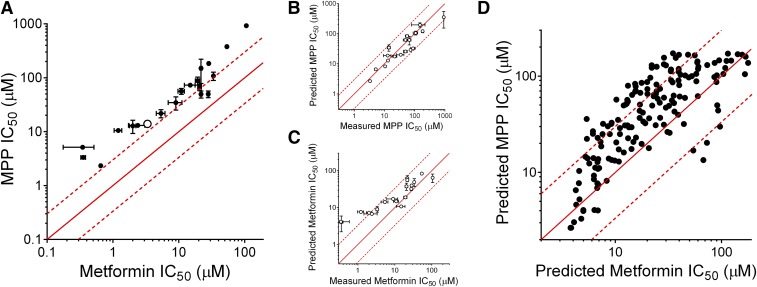
Fig. 7.
Pairwise comparisons of IC50 values (micromolar) for the inhibition of OCT2-mediated transport of structurally distinct substrates. (A) Pairwise comparison of IC50 values for the inhibition of OCT2-mediated transport of metformin (x-axis) and MPP (y-axis) determined for a subset of 20 compounds selected from the NCC (Table 2) (note the pairwise comparison of IC50 values for irinotecan, shown as an open circle). Each IC50 value is the mean ± S.E. (n = 2) of values determined in two separate experiments using the experimental design used for the experiments presented in Fig. 6 (also Supplemental Fig. 2). In this comparison (and the others), the line of unity (equal IC50 values for the inhibition of both substrates) is represented by the solid red line, and dashed lines represent ratios of IC50 values that differ from one another by 3-fold. Pairwise comparison of measured (x-axes) and predicted IC50 values for the inhibition of MPP transport (B) or metformin transport (C). Measured values are those shown in (A) (Table 2); predicted values were calculated using the single-point method (see Materials and Methods). (D) Pairwise comparisons of predicted IC50 values for the inhibition of metformin transport against those for MPP transport for 162 compounds from the NCC that inhibited transport by between 10% and 90%.

