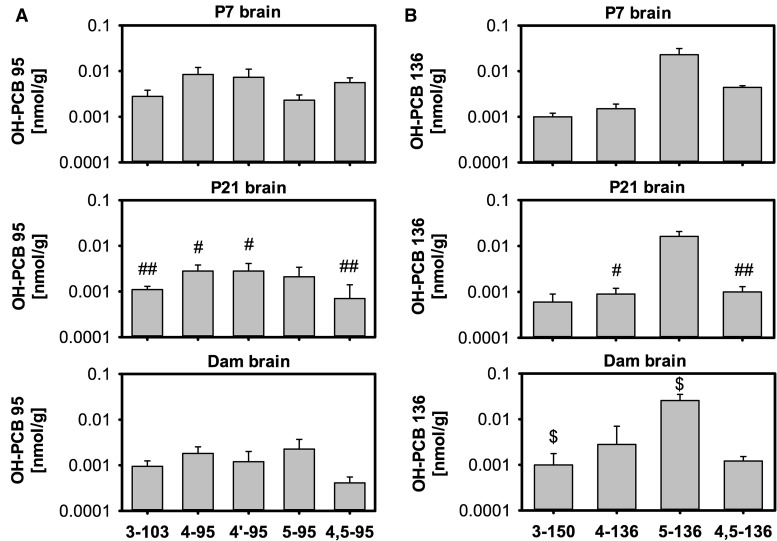
FIG. 4.
Brain profiles of OH-PCB metabolites differ among P7 and P21 pups and dams exposed to PCB 95 (A) or PCB 136 (B). Values are adjusted for tissue wet weight and presented on a logarithmic scale as mean ± SD of average levels for male and female pups from the same litter (n = 5 or 6 litters; see Supplementary Tables 1 and 2 for additional details). #OH-PCB levels significantly different from brain of P7 pups; P < .05; ## OH-PCB levels significantly different from brain of P7 pups; P < .01. $OH-PCB levels significantly different from levels in the same tissue from pups euthanized on P21; P < .05.

