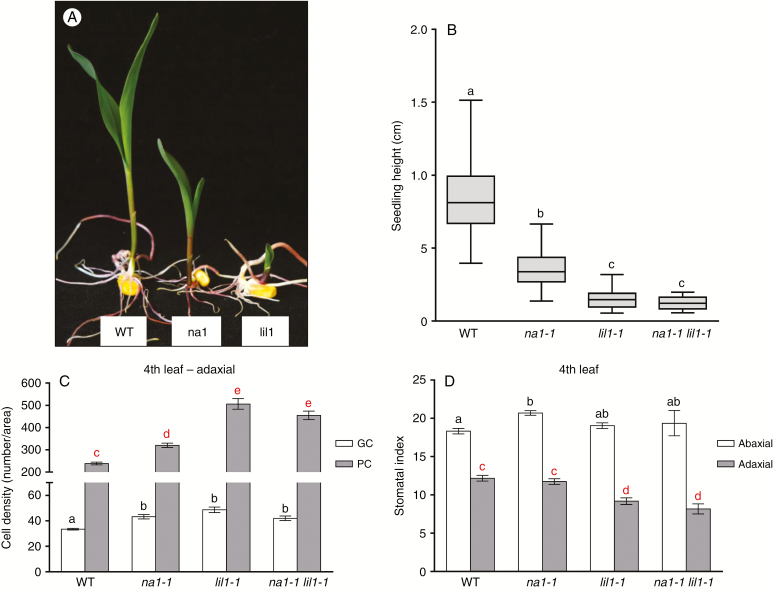
Fig. 3.
The lil1-1 mutant is epistatic to the na1-1 mutant . (A) Representative wild-type (WT), na1-like (na1) and lil1-like (lil1) phenotypes of 10-day old F2 plants obtained from selfing F1 heterozygous na1-1/+ lil1-1/+ plants. (B–D) Characterization of WT, homozygous na1-1, homozygous lil1-1 and double-homozygous na1-1 lil1-1 genotypic classes. (B) Whisker plot representing seedling height of 10-day old plants. (C) Numbers of guard cells (GC) and pavement cells (PC). (D) Stomatal index of fourth fully expanded leaves of 50-day old plants. Error bars show the standard error. In (B), (C) and (D) different letters denote differences between values that are statistically significant (P < 0.05) as calculated by one-way ANOVA. In (C) GC (black letters) or PC (red letters) values were compared. In (D) abaxial (black letters) or adaxial (red letters) values were compared.

