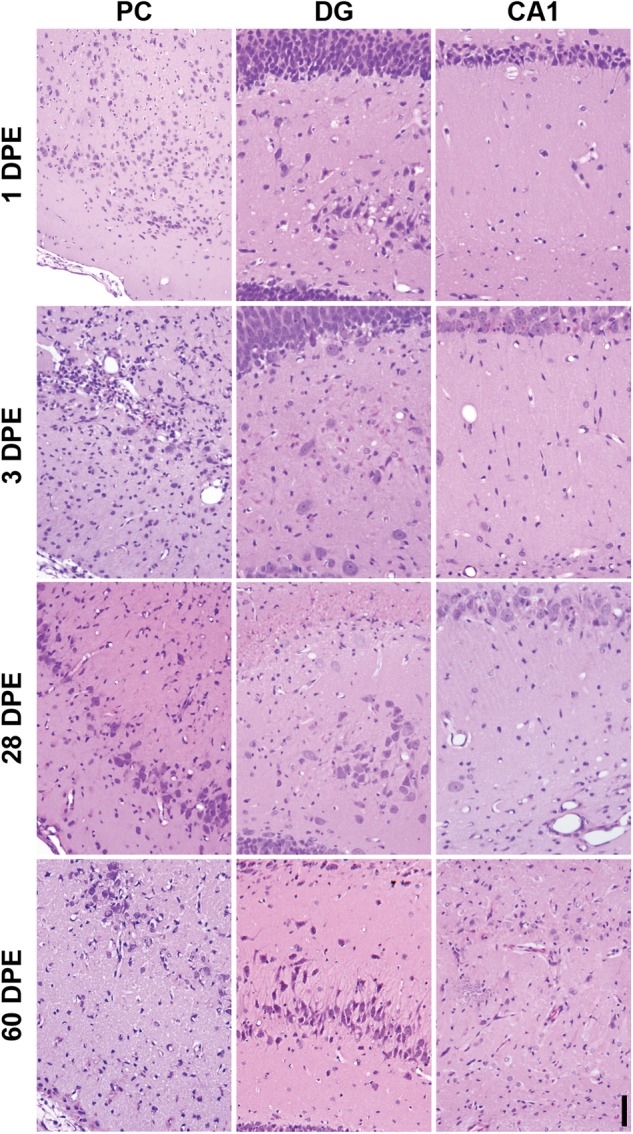
FIG. 3.

Representative photomicrographs illustrating the differing stages of neuropathology in the piriform cortex (PC), dentate gyrus (DG), and CA1 region of the hippocampus (CA1) in diisopropylfluorophosphate (DFP) rats. All images at × 200 magnification, bar = 50 µm.
