
Figure 2.
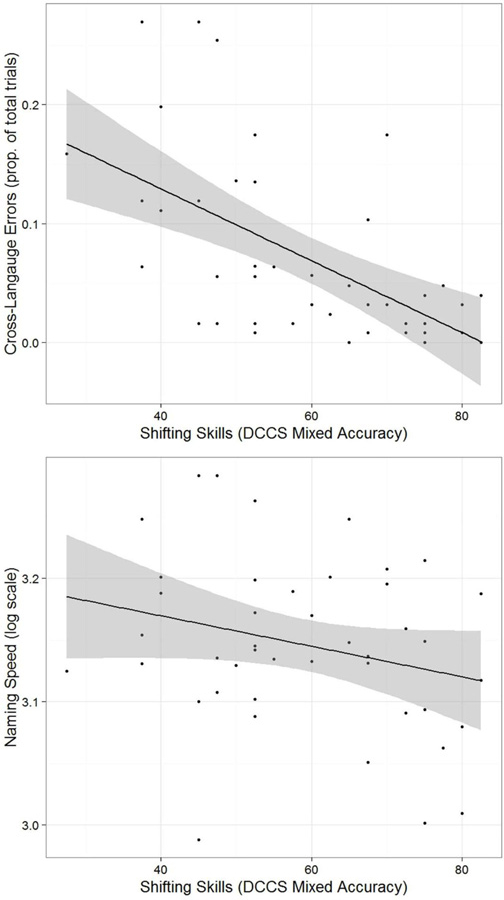
Cross-language error rate (top) and naming speed (ms log10 scale, bottom), as a function of task-shifting ability. These figures present the bivariate correlations from the raw data; they are not derived from the mixed-effects models. Each point represents a participant. Gray shading indicates 95% confidence interval.